
UFP Industries Reports Record Second Quarter Results
“In the last year and a half,
Second Quarter 2021 Highlights (comparisons on a year-over-year basis):
- Net sales of
$2.7 billion increased 117 percent due to a 70 percent increase in selling prices, a 36 percent unit increase from acquisitions, and an 11 percent increase in organic unit sales. - Earnings from operations of
$236.9 million increased 157 percent, including the impact of an inventory valuation reserve. Management evaluated the impact of falling lumber prices on its products sold with a variable price tied to the lumber market, primarily in its ProWood and Sunbelt wood pressure-treating operations. As a result of its evaluation, a lower of cost or net realizable value reserve was recorded, which reduced the value of inventory and gross profits by approximately$23 million . The company’s vendor-managed inventory programs and ability to shift lumber inventory to business units with high demand and volume requirements helped mitigate the impact of the decline in prices on variable-priced products, particularly in its ProWood business unit. - An increase in SG&A of nearly
$71 million , or 62 percent, is largely attributable to recent acquisitions ($15 million , including amortization expense of$1.5 million ) and increases in bonus and sales compensation resulting from increased profitability (up$33 million and$9 million , respectively, over 2020). SG&A as a percentage of gross profit improved from 56 percent in 2020 to 44 percent in 2021, as the company continues to focus on leveraging its cost structure as it grows. - New product sales of
$232.1 million increased 61 percent. - Adjusted EBITDA of
$261.5 million increased 137 percent and the adjusted EBITDA margin expanded by 80 basis points to 9.7 percent.
“We remain optimistic about the rest of this year and our prospects in 2022,” said Missad. “We expect market conditions to normalize during the second half of 2021. While falling lumber prices and more normalized demand create challenging year-over-year profitability comparisons for our retail segment, the stabilized lumber market should benefit our industrial and construction segments. Furthermore, we expect all of our segments to benefit from more stable pricing in 2022. In addition, our industrial and retail segments should continue to benefit from the integration of our recent acquisitions of
By business segment, the company reported the following second quarter 2021 results:
UFP Retail Solutions
$1.26 billion in net sales, up 107 percent over the second quarter of 2020 due to a 59 percent increase in selling prices and a 48 percent unit increase due to the acquisitions ofSunbelt Forest Products and Spartanburg Forest Products. Organic unit sales fell 4 percent due to a 17 percent decline in the ProWood business unit. Organic growth was achieved by UFP-Edge (up 27 percent),Deckorators (up 11 percent), and Outdoor Essentials (up 6 percent), due in part to expanded operational capacity. Additional capacity for each of these product lines is expected to come online in 2022. New product sales grew 32 percent, driven by UFP-Edge shiplap and trim, ProWood Fire Retardant treated lumber, and Outdoor Essentials fencing and picnic tables.- Gross profit dollars for the retail segment grew 47 percent. Acquisitions contributed approximately
$3.5 million , or 4 percent, to the increase and were significantly impacted by the inventory valuation reserve.
$611 million in net sales, up 172 percent from the second quarter of 2020, reflecting in part the benefits of reopening theU.S. economy after pandemic-related closures. Unit sales increased 73 percent and selling prices increased 99 percent. Organic growth accounted for 26 percent of the unit sales growth; the acquisitions ofPalletOne andT&R Lumber accounted for 47 percent. New product sales grew 192 percent from the second quarter of 2020.- Gross profit for the segment rose 262 percent, exceeding unit sales growth of 73 percent, due to the company’s focus on adding value-added products and the significant improvement in unit sales, which allows the company to better leverage fixed costs and include the impact of higher lumber, labor, and transportation costs in its selling prices. Acquisitions contributed over
$23 million , or 62 percent, to the increase in gross profit.
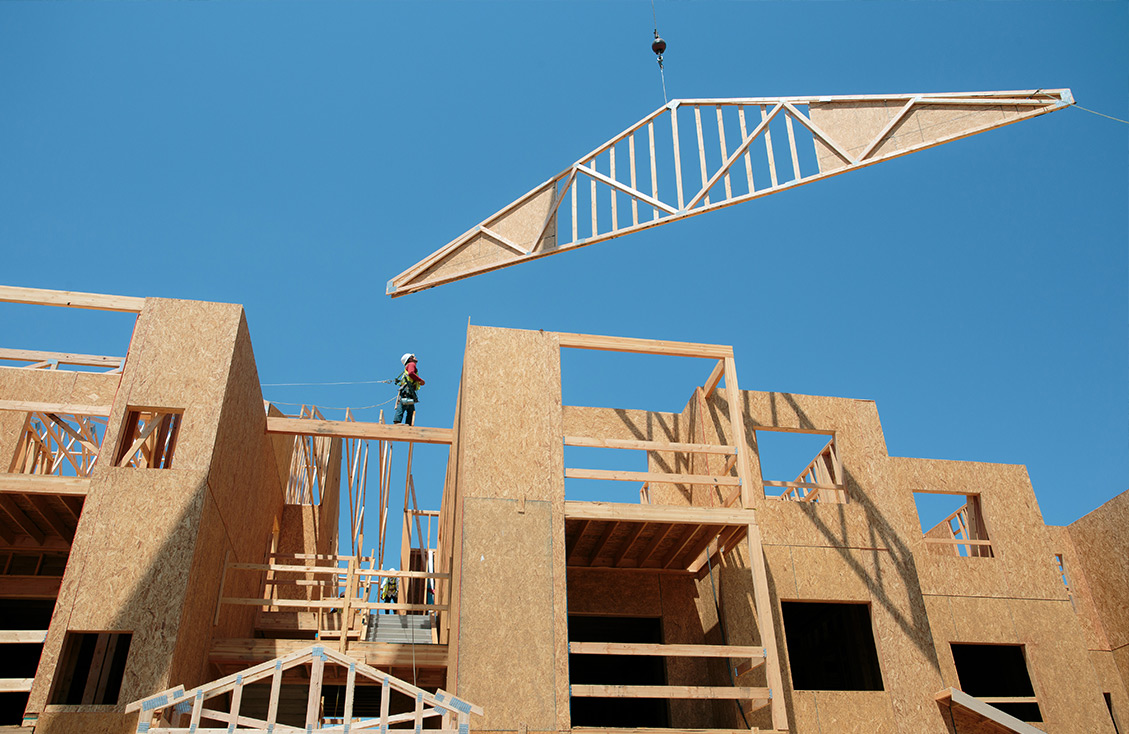
$739 million in net sales, up 106 percent over the second quarter of 2020, due to a 29 percent increase in unit sales and a 77 percent increase in selling prices. Unit sales to factory-built and site-built housing customers rose 56 percent and 32 percent, respectively. Unit sales to commercial customers improved, rising 11 percent. New product sales increased 184 percent from the prior comparative quarterly period.- Gross profit for the construction segment grew 118 percent over the second quarter of 2020, primarily as a result of significantly improved unit sales and the company’s ability to better leverage fixed costs and include the impact of higher lumber, labor, and transportation costs in its selling prices.
CONFERENCE CALL
This press release contains forward-looking statements within the meaning of Section 21E of the Securities Exchange Act, as amended, that are based on management’s beliefs, assumptions, current expectations, estimates and projections about the markets we serve, the economy and the Company itself. Words like “anticipates,” “believes,” “confident,” “estimates,” “expects,” “forecasts,” “likely,” “plans,” “projects,” “should,” variations of such words, and similar expressions identify such forward-looking statements. These statements do not guarantee future performance and involve certain risks, uncertainties and assumptions that are difficult to predict with regard to timing, extent, likelihood and degree of occurrence. The Company does not undertake to update forward-looking statements to reflect facts, circumstances, events, or assumptions that occur after the date the forward-looking statements are made. Actual results could differ materially from those included in such forward-looking statements. Investors are cautioned that all forward-looking statements involve risks and uncertainty. Among the factors that could cause actual results to differ materially from forward-looking statements are the following: fluctuations in the price of lumber; adverse or unusual weather conditions; adverse economic conditions in the markets we serve; government regulations, particularly involving environmental and safety regulations; and our ability to make successful business acquisitions. Certain of these risk factors as well as other risk factors and additional information are included in the Company's reports on Form 10-K and 10-Q on file with the
Non-GAAP Financial Information
This release includes certain financial information not prepared in accordance with
Net earnings
Net earnings refers to net earnings attributable to controlling interest unless specifically noted.
---------------AT THE COMPANY---------------
VP, Business Outreach
(616) 365-1555
| CONSOLIDATED CONDENSED STATEMENTS OF EARNINGS AND COMPREHENSIVE INCOME (UNAUDITED) | |||||||||||||||||||||||||||||
| FOR THE THREE AND SIX MONTHS ENDED | |||||||||||||||||||||||||||||
| JUNE 2021/2020 | |||||||||||||||||||||||||||||
| Quarter Period | Year to Date | ||||||||||||||||||||||||||||
| (In thousands, except per share data) | 2021 | 2020 | 2021 | 2020 | |||||||||||||||||||||||||
| $ | 2,700,541 | 100.0 | % | $ | 1,242,001 | 100.0 | % | $ | 4,525,545 | 100.0 | % | $ | 2,274,063 | 100.0 | % | ||||||||||||||
| COST OF GOODS SOLD | 2,279,247 | 84.4 | 1,037,070 | 83.5 | 3,817,697 | 84.4 | 1,901,896 | 83.6 | |||||||||||||||||||||
| GROSS PROFIT | 421,294 | 15.6 | 204,931 | 16.5 | 707,848 | 15.6 | 372,167 | 16.4 | |||||||||||||||||||||
| SELLING, GENERAL AND ADMINISTRATIVE EXPENSES | 184,539 | 6.8 | 113,781 | 9.2 | 334,637 | 7.4 | 223,121 | 9.8 | |||||||||||||||||||||
| OTHER GAINS, NET | (180 | ) | — | (1,209 | ) | (0.1 | ) | (1,211 | ) | — | (1,944 | ) | (0.1 | ) | |||||||||||||||
| EARNINGS FROM OPERATIONS | 236,935 | 8.8 | 92,359 | 7.4 | 374,422 | 8.3 | 150,990 | 6.6 | |||||||||||||||||||||
| OTHER EXPENSE, NET | 3,045 | 0.1 | (992 | ) | (0.1 | ) | 4,530 | 0.1 | 3,747 | 0.2 | |||||||||||||||||||
| EARNINGS BEFORE INCOME TAXES | 233,890 | 8.7 | 93,351 | 7.5 | 369,892 | 8.2 | 147,243 | 6.5 | |||||||||||||||||||||
| INCOME TAXES | 58,530 | 2.2 | 23,657 | 1.9 | 90,281 | 2.0 | 36,979 | 1.6 | |||||||||||||||||||||
| NET EARNINGS | 175,360 | 6.5 | 69,694 | 5.6 | 279,611 | 6.2 | 110,264 | 4.8 | |||||||||||||||||||||
| LESS NET EARNINGS ATTRIBUTABLE TO NONCONTROLLING INTEREST | (1,978 | ) | (0.1 | ) | (3,231 | ) | (0.3 | ) | (2,918 | ) | (0.1 | ) | (3,642 | ) | (0.2 | ) | |||||||||||||
| NET EARNINGS ATTRIBUTABLE TO CONTROLLING INTEREST | $ | 173,382 | 6.4 | $ | 66,463 | 5.4 | $ | 276,693 | 6.1 | $ | 106,622 | 4.7 | |||||||||||||||||
| EARNINGS PER SHARE - BASIC | $ | 2.79 | $ | 1.08 | $ | 4.46 | $ | 1.73 | |||||||||||||||||||||
| EARNINGS PER SHARE - DILUTED | $ | 2.78 | $ | 1.08 | $ | 4.45 | $ | 1.73 | |||||||||||||||||||||
| COMPREHENSIVE INCOME | 178,080 | 81,089 | 280,135 | 113,103 | |||||||||||||||||||||||||
| LESS COMPREHENSIVE INCOME ATTRIBUTABLE TO NONCONTROLLING INTEREST | (2,698 | ) | (5,691 | ) | (3,112 | ) | (3,767 | ) | |||||||||||||||||||||
| COMPREHENSIVE INCOME ATTRIBUTABLE TO CONTROLLING INTEREST | $ | 175,382 | $ | 75,398 | $ | 277,023 | $ | 109,336 | |||||||||||||||||||||
| JUNE 2021/2020 | ||||||||||||||||||||||||||||||
| (In thousands) | Quarter Period | Year to Date | ||||||||||||||||||||||||||||
| Segment Classification | 2021 | 2020 | % | 2021 | 2020 | % | ||||||||||||||||||||||||
| Retail | $ | 1,259,218 | $ | 609,190 | 106.7 | % | $ | 2,018,239 | $ | 961,351 | 109.9 | % | ||||||||||||||||||
| Industrial | 611,181 | 224,379 | 172.4 | % | 1,060,054 | 480,922 | 120.4 | % | ||||||||||||||||||||||
| Construction | 738,704 | 359,170 | 105.7 | % | 1,298,235 | 740,325 | 75.4 | % | ||||||||||||||||||||||
| All Other | 91,438 | 49,262 | 85.6 | % | 149,017 | 91,465 | 62.9 | % | ||||||||||||||||||||||
| Total |
$ | 2,700,541 | $ | 1,242,001 | 117.4 | % | $ | 4,525,545 | $ | 2,274,063 | 99.0 | % | ||||||||||||||||||
| 2021 | % of Sales | 2020 | % of Sales | 2021 | % of Sales | 2020 | % of Sales | |||||||||||||||||||||||
| SG&A | $ | 184,539 | 6.8 | % | $ | 113,781 | 9.2 | % | $ | 334,637 | 7.4 | % | $ | 223,121 | 9.8 | % | ||||||||||||||
| SG&A as a Percentage of Gross Profit | 43.8 | % | 55.5 | % | 47.3 | % | 60.0 | % | ||||||||||||||||||||||
| CONSOLIDATED CONDENSED BALANCE SHEETS (UNAUDITED) | ||||||||||||||
| JUNE 2021/2020 | ||||||||||||||
| JUNE 2021/2020 | ||||||||||||||
| (In thousands) | ||||||||||||||
| ASSETS | 2021 | 2020 | LIABILITIES AND EQUITY | 2021 | 2020 | |||||||||
| CURRENT ASSETS | CURRENT LIABILITIES | |||||||||||||
| Cash and cash equivalents | $ | 44,286 | $ | 200,546 | Cash Overdraft | $ | 34,229 | $ | — | |||||
| Restricted cash | 629 | 724 | Accounts payable | 359,484 | 199,338 | |||||||||
| Investments | 33,827 | 19,195 | Accrued liabilities | 337,507 | 233,088 | |||||||||
| Accounts receivable | 980,571 | 522,930 | Current portion of debt | 97 | 2,786 | |||||||||
| Inventories | 1,026,488 | 459,424 | ||||||||||||
| Other current assets | 36,699 | 33,786 | ||||||||||||
| TOTAL CURRENT ASSETS | 2,122,500 | 1,236,605 | TOTAL CURRENT LIABILITIES | 731,317 | 435,212 | |||||||||
| OTHER ASSETS | 146,486 | 120,464 | ||||||||||||
| INTANGIBLE ASSETS, NET | 424,110 | 299,963 | LONG-TERM DEBT AND FINANCE LEASE OBLIGATIONS | 571,856 | 161,057 | |||||||||
| OTHER LIABILITIES | 163,547 | 123,014 | ||||||||||||
| PROPERTY, PLANT AND EQUIPMENT, NET | 533,187 | 401,576 | EQUITY | 1,759,563 | 1,339,325 | |||||||||
| TOTAL ASSETS | $ | 3,226,283 | $ | 2,058,608 | TOTAL LIABILITIES AND EQUITY | $ | 3,226,283 | $ | 2,058,608 | |||||
| CONSOLIDATED CONDENSED STATEMENTS OF CASH FLOWS (UNAUDITED) | ||||||||
| FOR THE SIX MONTHS ENDED | ||||||||
| JUNE 2021/2020 | ||||||||
| (In thousands) | 2021 | 2020 | ||||||
| CASH FLOWS FROM OPERATING ACTIVITIES: | ||||||||
| Net earnings | $ | 279,611 | $ | 110,264 | ||||
| Adjustments to reconcile net earnings to net cash from operating activities: | ||||||||
| Depreciation | 38,342 | 31,330 | ||||||
| Amortization of intangibles | 7,193 | 3,129 | ||||||
| Expense associated with share-based and grant compensation arrangements | 5,742 | 2,303 | ||||||
| Deferred income taxes | 177 | 290 | ||||||
| Unrealized (gain) loss on investment and other | (2,784 | ) | 473 | |||||
| Equity in earnings of investee | 1,465 | — | ||||||
| Net gain on sale and disposition of assets | (1,577 | ) | (271 | ) | ||||
| Changes in: | ||||||||
| Accounts receivable | (336,094 | ) | (155,554 | ) | ||||
| Inventories | (329,577 | ) | 25,983 | |||||
| Accounts payable and cash overdraft | 143,018 | 57,017 | ||||||
| Accrued liabilities and other | 78,751 | 72,246 | ||||||
| (115,733 | ) | 147,210 | ||||||
| CASH FLOWS FROM INVESTING ACTIVITIES: | ||||||||
| Purchases of property, plant, and equipment | (79,028 | ) | (46,730 | ) | ||||
| Proceeds from sale of property, plant and equipment | 6,673 | 644 | ||||||
| Acquisitions and purchase of noncontrolling interest, net of cash received | (433,239 | ) | (18,689 | ) | ||||
| Purchases of investments | (14,581 | ) | (20,094 | ) | ||||
| Proceeds from sale of investments | 6,885 | 18,339 | ||||||
| Other | (708 | ) | 318 | |||||
| (513,998 | ) | (66,212 | ) | |||||
| CASH FLOWS FROM FINANCING ACTIVITIES: | ||||||||
| Borrowings under revolving credit facilities | 849,944 | 6,759 | ||||||
| Repayments under revolving credit facilities | (589,695 | ) | (6,498 | ) | ||||
| Contingent consideration payment and other | (1,464 | ) | (3,077 | ) | ||||
| Proceeds from issuance of common stock | 936 | 697 | ||||||
| Dividends paid to shareholders | (18,550 | ) | (15,374 | ) | ||||
| Distributions to noncontrolling interest | (2,914 | ) | (299 | ) | ||||
| Repurchase of common stock | — | (29,212 | ) | |||||
| Other | (331 | ) | 32 | |||||
| 237,926 | (46,972 | ) | ||||||
| Effect of exchange rate changes on cash | 112 | (1,422 | ) | |||||
| NET CHANGE IN CASH AND CASH EQUIVALENTS | (391,693 | ) | 32,604 | |||||
| ALL CASH AND CASH EQUIVALENTS, BEGINNING OF PERIOD | 436,608 | 168,666 | ||||||
| ALL CASH AND CASH EQUIVALENTS, END OF PERIOD | $ | 44,915 | $ | 201,270 | ||||
| Reconciliation of cash and cash equivalents and restricted cash: | ||||||||
| Cash and cash equivalents, beginning of period | $ | 436,507 | $ | 168,336 | ||||
| Restricted cash, beginning of period | 101 | 330 | ||||||
| All cash and cash equivalents, beginning of period | $ | 436,608 | $ | 168,666 | ||||
| Cash and cash equivalents, end of period | $ | 44,286 | $ | 200,546 | ||||
| Restricted cash, end of period | 629 | 724 | ||||||
| All cash and cash equivalents, end of period | $ | 44,915 | $ | 201,270 | ||||
| ADJUSTED EBITDA RECONCILIATION (UNAUDITED) | |||||||||||||||
| FOR THE THREE AND SIX MONTHS ENDED | |||||||||||||||
| JUNE 2021/2020 | |||||||||||||||
| Quarter Period | Year to Date | ||||||||||||||
| (In thousands) | 2021 | 2020 | 2021 |
2020 | |||||||||||
| Net earnings | $ | 175,360 | $ | 69,694 | $ | 279,611 | $ | 110,264 | |||||||
| Interest expense | 3,899 | 1,898 | 7,050 | 3,805 | |||||||||||
| Interest and investment income | (659 | ) | (189 | ) | (1,201 | ) | (530 | ) | |||||||
| Income taxes | 58,530 | 23,657 | 90,281 | 36,979 | |||||||||||
| Expenses associated with share-based compensation arrangements | 2,761 | 859 | 5,742 | 2,303 | |||||||||||
| Net (gain) loss on disposition and impairment of assets | (1,045 | ) | 14 | (1,577 | ) | (271 | ) | ||||||||
| Equity in Earnings of Investee | 835 | — | 1,465 | — | |||||||||||
| Unrealized (gain) loss on investments | (1,030 | ) | (2,701 | ) | (2,784 | ) | 472 | ||||||||
| Depreciation expense | 19,609 | 15,613 | 38,342 | 31,330 | |||||||||||
| Amortization of intangibles | 3,195 | 1,558 | 7,193 | 3,129 | |||||||||||
| Adjusted EBITDA | $ | 261,455 | $ | 110,403 | $ | 424,122 | $ | 187,481 | |||||||
![]()
Source: UFP Industries, Inc.