UNITED STATES
SECURITIES AND EXCHANGE COMMISSION
Washington, D.C. 20549
FORM
CURRENT REPORT
Pursuant to Section 13 OR 15(d) of the Securities Exchange Act of 1934
Date of Report (Date of earliest event reported):
(Exact name of registrant as specified in its charter)
Registrant's telephone number, including area code: (
None
(Former name or former address, if changed since last report)
Check the appropriate box below if the Form 8-K filing is intended to simultaneously satisfy the filing obligation of the registrant under any of the following provisions:
Securities registered pursuant to Section 12(b) of the Act:
Title of each class | Trading Symbol(s) | Name of each exchange on which registered |
The |
Indicate by check mark whether the registrant is an emerging growth company as defined in Rule 405 of the Securities Act of 1933 (§230.405 of this chapter) or Rule 12b-2 of the Securities Exchange Act of 1934 (§240.12b-2 of this chapter).
Emerging growth company
If an emerging growth company, indicate by check mark if the registrant has elected not to use the extended transition period for complying with any new or revised financial accounting standards provided pursuant to Section 13(a) of the Exchange Act. ☐
Item 7.01. Regulation FD Disclosure.
Attached as Exhibit 99.1 is the Company's current version of its first quarter 2021 Investor Relations Presentation provided to investors and posted on the Company's website at www.ufpi.com.
The information in this Form 8-K and the attached Exhibit shall not be deemed filed for purposes of Section 18 of the Securities Exchange Act of 1934, as amended, nor shall they be deemed incorporated by reference in any filing under the Securities Act of 1933, as amended.
Item 9.01. Exhibits.
Exhibits
99.1 | |
104 | Cover Page Interactive File (the cover page XBRL tags are embedded in the Inline XBRL document). |
2
SIGNATURE
Pursuant to the requirements of the Securities Exchange Act of 1934, the registrant has duly caused this report to be signed on its behalf by the undersigned thereunto duly authorized.
Dated: May 7, 2021 | UFP INDUSTRIES, INC. | |
(Registrant) | ||
By: | /s/ Michael R. Cole | |
Michael R. Cole | ||
Principal Financial Officer and Treasurer | ||
3
Exhibit 99.1
| 1 2020 Investor Relations Presentation |

| 2 UFP INDUSTRIES, INC. 2021 Please be aware that: Statements included in this presentation that are not historical are forward-looking statements within the meaning of Section 21E of the Securities Exchange Act, as amended, and are based on management’s beliefs, assumptions, current expectations, estimates, and projections about the markets we serve, the economy, and the company itself. Words like “anticipates,” “believes,” “confident,” “estimates,” “expects,” “forecasts,” likely,” “plans,” “projects,” “should,” variations of such words, and similar expressions identify such forward-looking statements. These statements do not guarantee future performance and involve certain risks, uncertainties and assumptions that are difficult to predict with regard to timing, extent, likelihood and degree of occurrence. The Company does not undertake to update forward-looking statements to reflect facts, circumstances, assumptions or events that occur after the date the forward-looking statements are made. Actual results could differ materially from those included in such forward-looking statements. Investors are cautioned that all forward- looking statements involve risks and uncertainty. Among the factors that could cause actual results to differ materially from forward-looking statements are the following: Fluctuations in the price of lumber; adverse or unusual weather conditions; adverse conditions in the markets we serve; government regulations, particularly involving environmental and safety regulations; and our ability to make successful business acquisitions. Certain of these risk factors as well as other risk factors and additional information are included in the Company's reports on Form 10-K and 10-Q on file with the Securities and Exchange Commission. This presentation is the property of UFP Industries, Inc. Any redistribution, retransmission, or reprinting of this presentation in any form without the express written consent of Universal is strictly prohibited. |
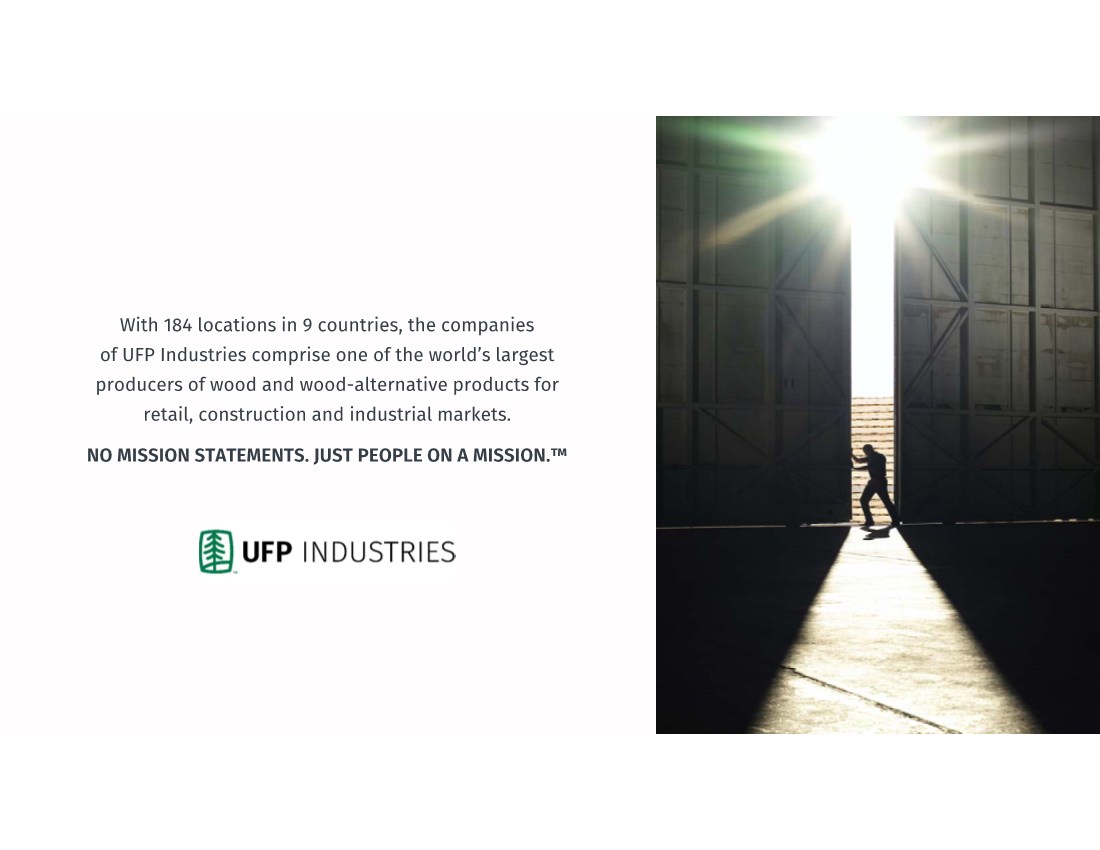
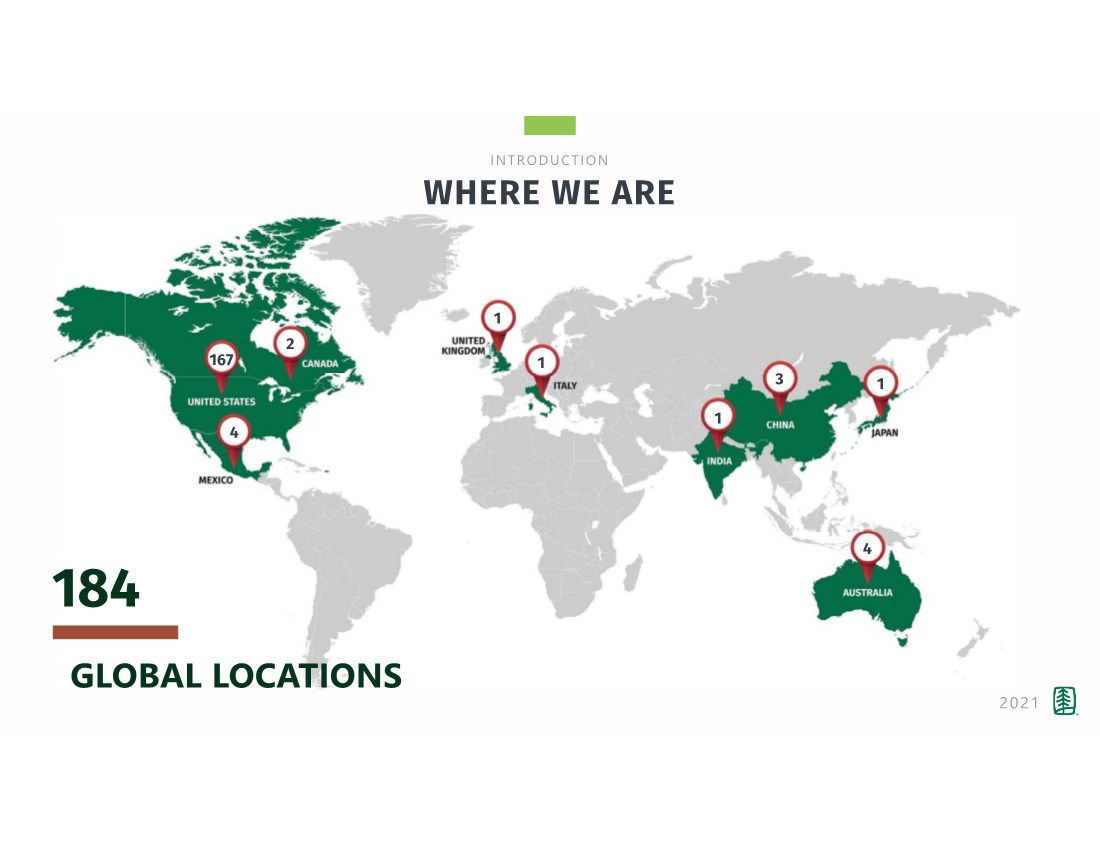
| 3 With 184 locations in 9 countries, the companies of UFP Industries comprise one of the world’s largest producers of wood and wood-alternative products for retail, construction and industrial markets. NO MISSION STATEMENTS. JUST PEOPLE ON A MISSION.™ |
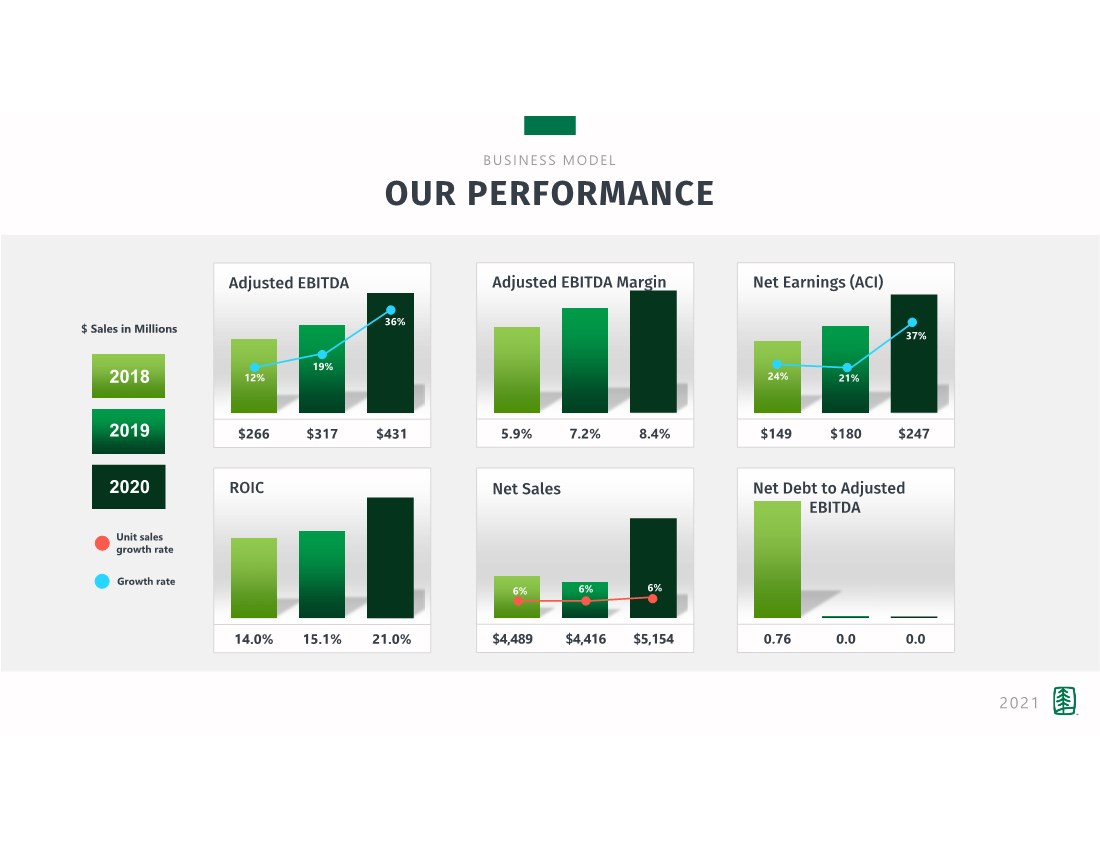
| 4 BUSINESS MODEL OUR PERFORMANCE 2021 5.9% Adjusted EBITDA Margin 7.2% 8.4% $4,489 Net Sales $4,416 $5,154 $149 Net Earnings (ACI) $180 $247 0.76 Net Debt to Adjusted EBITDA 0.0 0.0 $266 Adjusted EBITDA $317 $431 14.0% ROIC 15.1% 21.0% 2018 2019 2020 Unit sales growth rate 6% 6% 6% 12% 19% 36% $ Sales in Millions Growth rate 24% 21% 37% |
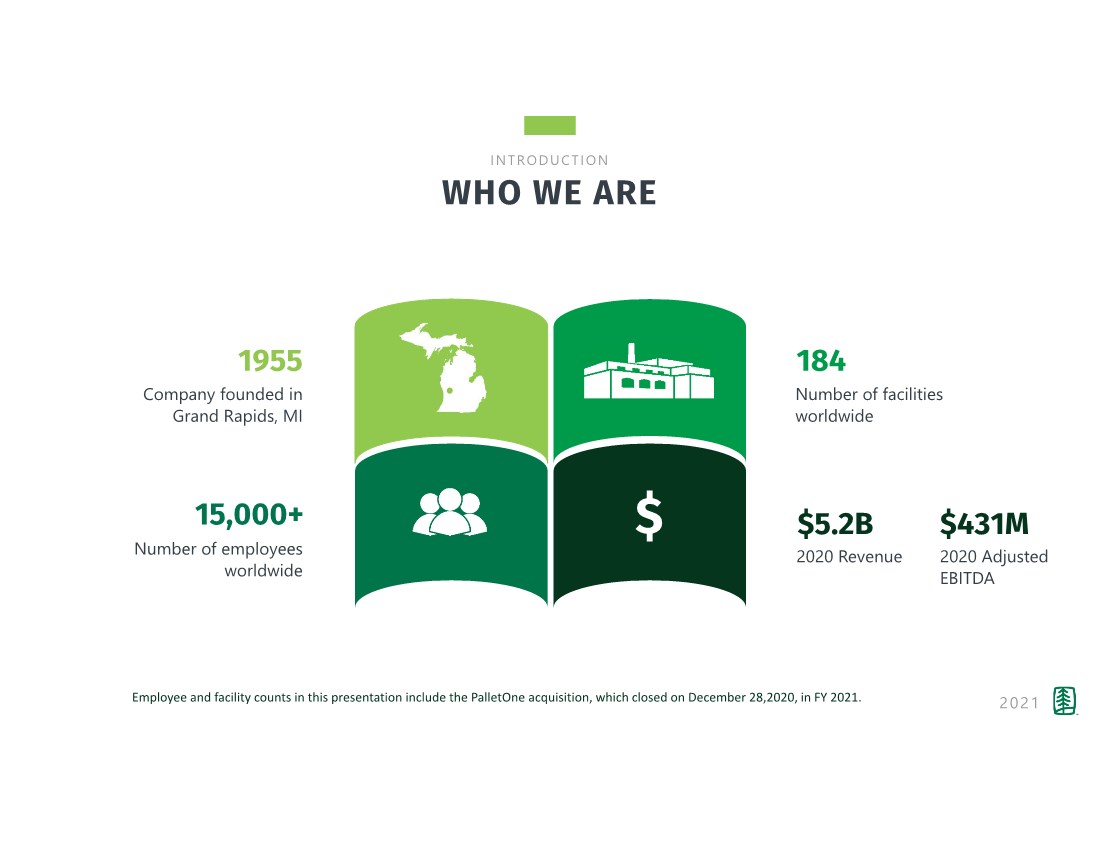
| 5 Company founded in Grand Rapids, MI 1955 INTRODUCTION WHO WE ARE Number of employees worldwide 15,000+ Number of facilities worldwide 184 2021 2020 Revenue $5.2B 2020 Adjusted EBITDA $431M $ Employee and facility counts in this presentation include the PalletOne acquisition, which closed on December 28,2020, in FY 2021. |
| 6 INTRODUCTION WHERE WE ARE 2021 167 2 4 1 1 3 1 4 GLOBAL LOCATIONS 184 1 |
| 7 Industrial - $1.1B Big box, independents, & buying co-ops Single and multi-family builders, commercial builders, concrete formers, factory-built housing (mobile & modular homes) & RVs Industrial packaging, packaging materials & OEM components Based on 2020 Sales INTRODUCTION OUR CUSTOMERS Retail - $2.2B Construction - $1.7B 34% 2021 International - $0.2B Overseas sourcing and selling with manufacturing and design assets in nine countries. 36% 34% 25% 5% |

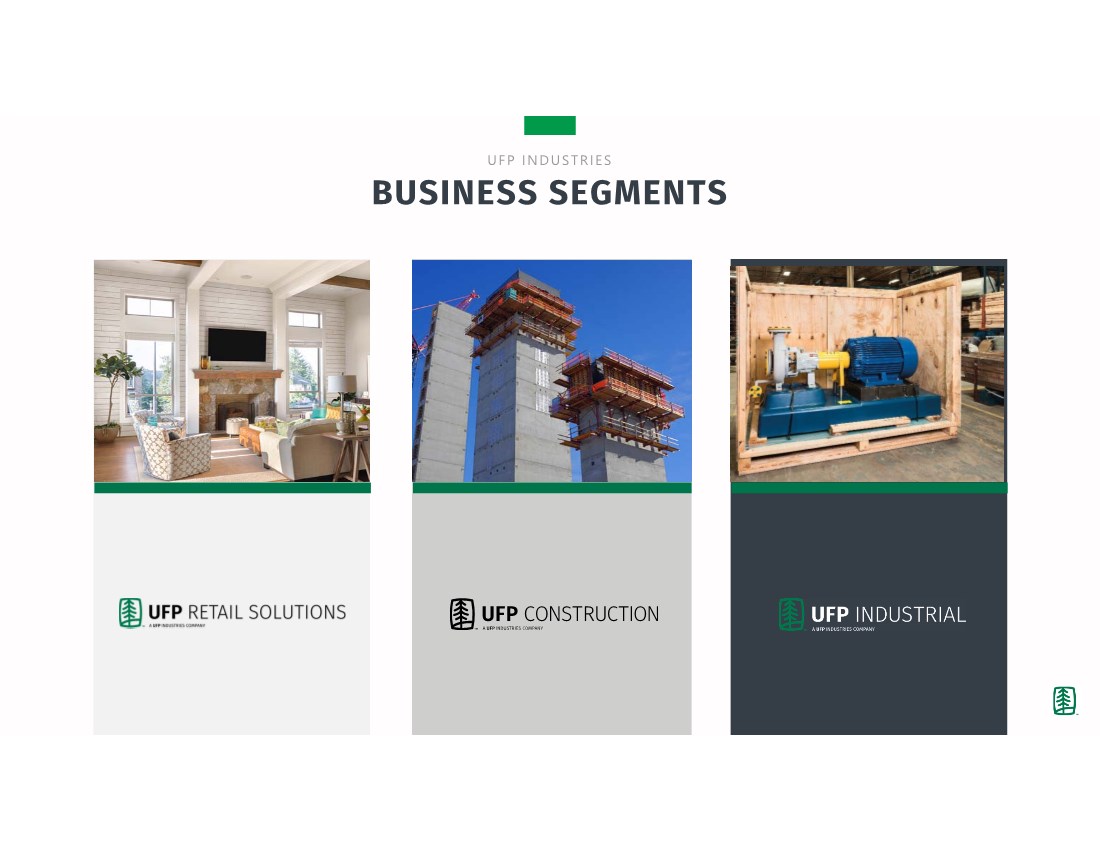
| 8 UFP INDUSTRIES BUSINESS SEGMENTS |
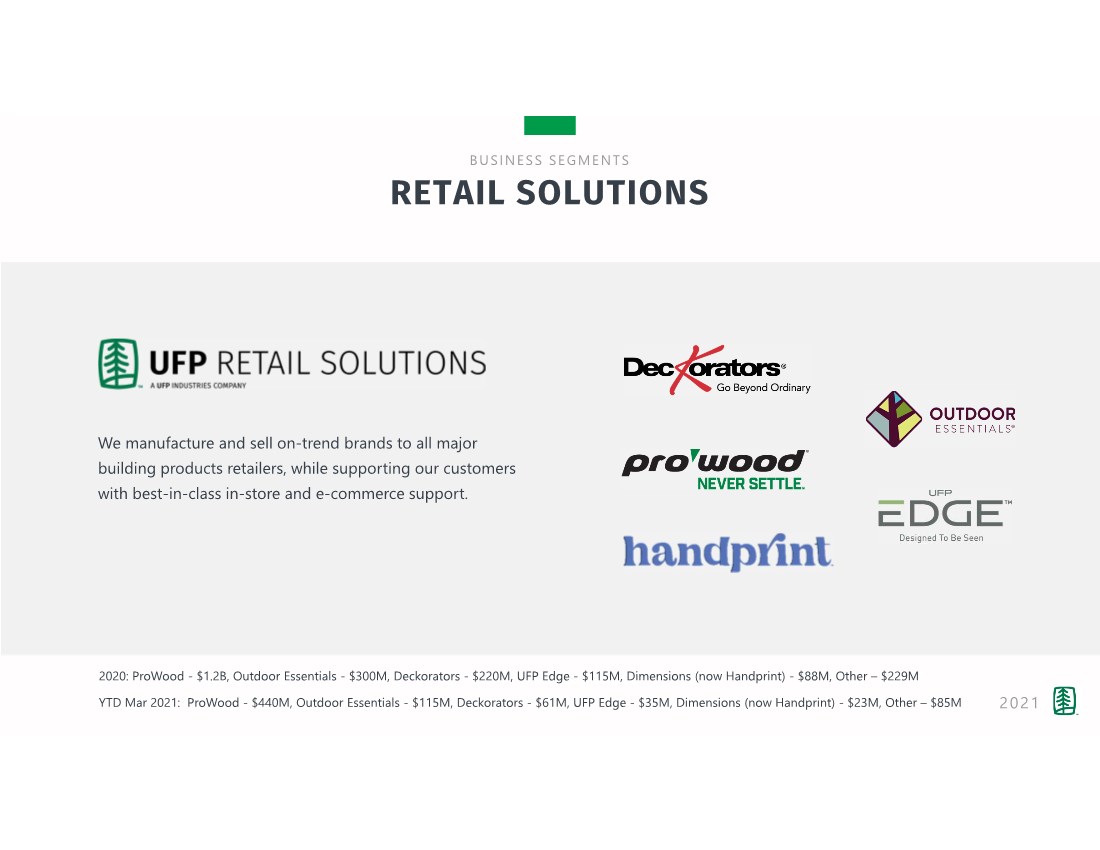
| 9 We manufacture and sell on-trend brands to all major building products retailers, while supporting our customers with best-in-class in-store and e-commerce support. BUSINESS SEGMENTS RETAIL SOLUTIONS 2021 2020: ProWood - $1.2B, Outdoor Essentials - $300M, Deckorators - $220M, UFP Edge - $115M, Dimensions (now Handprint) - $88M, Other – $229M YTD Mar 2021: ProWood - $440M, Outdoor Essentials - $115M, Deckorators - $61M, UFP Edge - $35M, Dimensions (now Handprint) - $23M, Other – $85M |
| 10 The industry’s leading innovator of composite decking, railing and accessories. Deckorators.com BUSINESS SEGMENTS RETAIL SOLUTIONS 2021 |

| 11 Preserved lumber including timbers, decking, construction materials and fire-treated. BUSINESS SEGMENTS RETAIL SOLUTIONS ProWoodLumber.com 2021 |

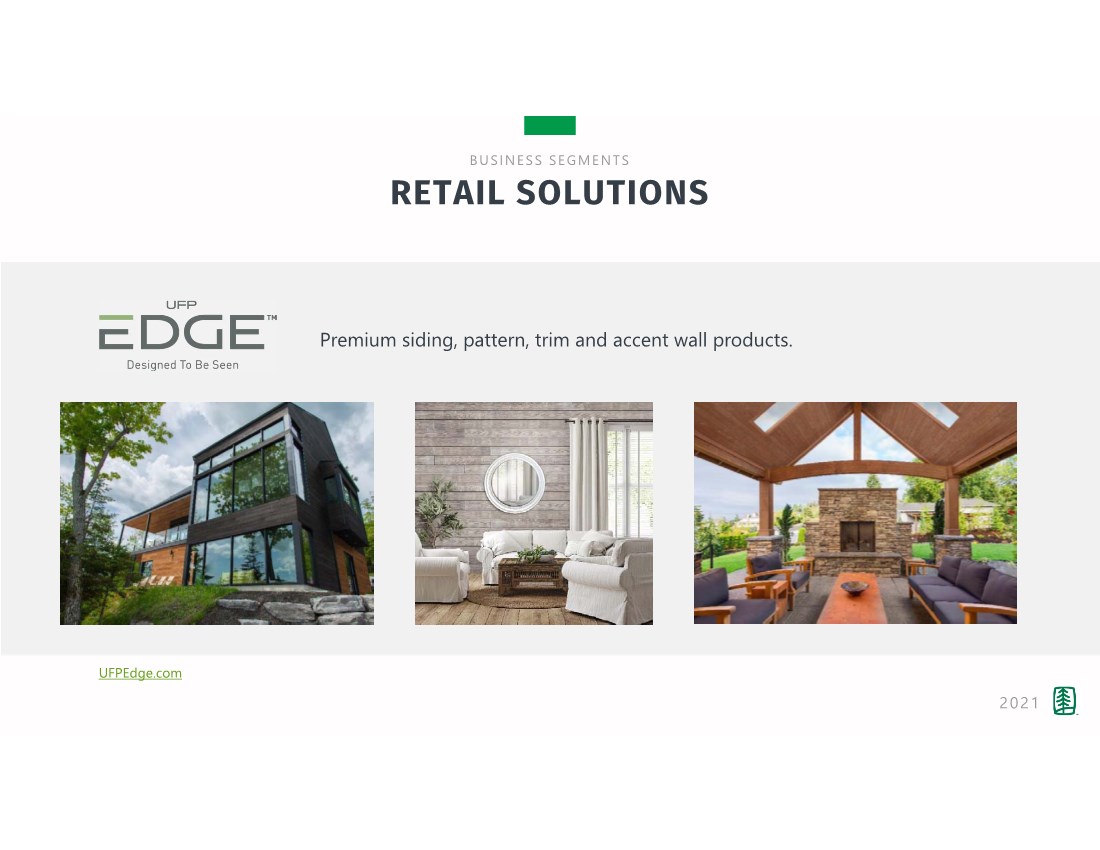
| 12 UFPEdge.com Premium siding, pattern, trim and accent wall products. BUSINESS SEGMENTS RETAIL SOLUTIONS 2021 |
| 13 OutdoorEssentialProducts.com Outdoor lifestyle products including wood and vinyl fencing, landscape and garden décor, picnic tables, pergolas, trellises and more. BUSINESS SEGMENTS RETAIL SOLUTIONS 2021 |

| 14 Coming soon: Handprintmade.com Wood components and ready-to-make products for a variety of inspired home décor and craft projects. BUSINESS SEGMENTS RETAIL SOLUTIONS 2021 |

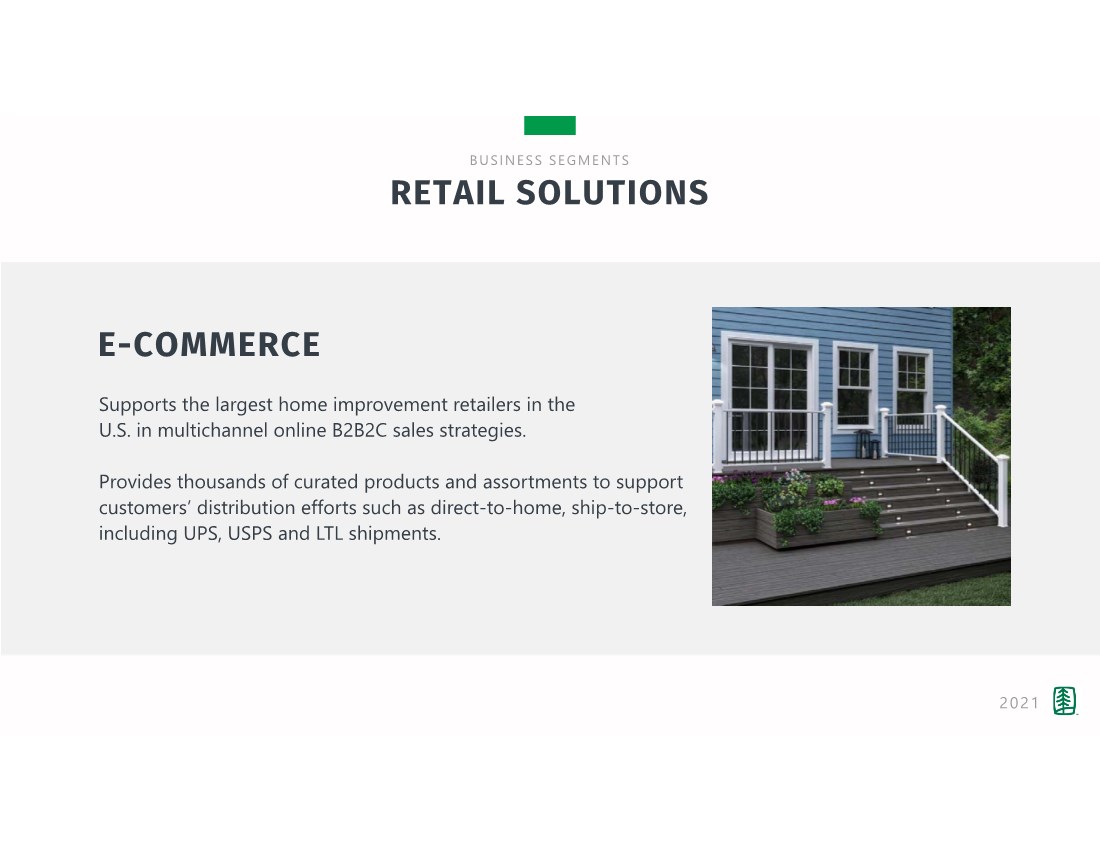
| 15 Supports the largest home improvement retailers in the U.S. in multichannel online B2B2C sales strategies. Provides thousands of curated products and assortments to support customers’ distribution efforts such as direct-to-home, ship-to-store, including UPS, USPS and LTL shipments. BUSINESS SEGMENTS RETAIL SOLUTIONS 2021 E-COMMERCE |
| 16 Single-source provider of concrete forms, building components, framing, exterior and interior finishing programs designed to make building processes run at maximum efficiency. BUSINESS SEGMENTS CONSTRUCTION • SITE BUILT • FACTORY-BUILT • CONCRETE FORMING • COMMERCIAL 2021 2020: Site Built - $726M, Factory Built - $597M, Commercial - $222M, Concrete Forming - $151M YTD Mar 2021: Site Built - $237M, Factory Built - $241M, Commercial - $51M, Concrete Forming - $31M |

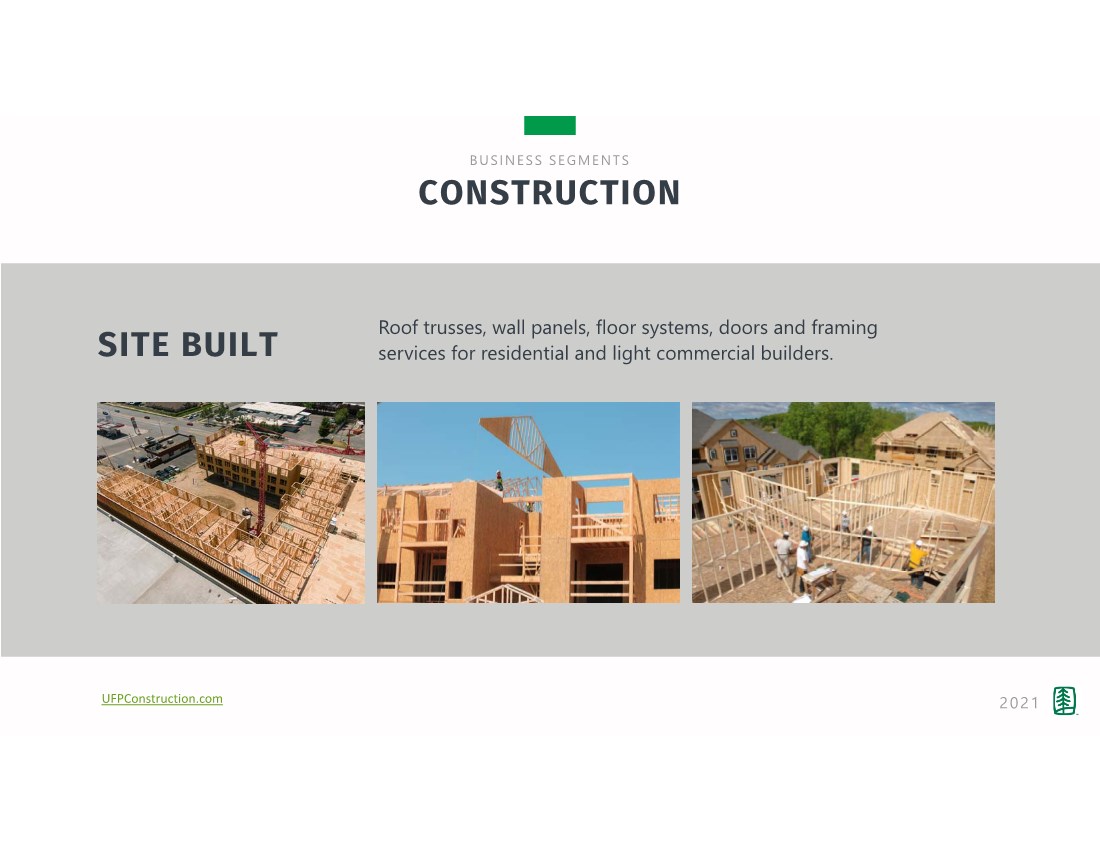
| 17 SITE BUILT Roof trusses, wall panels, floor systems, doors and framing services for residential and light commercial builders. BUSINESS SEGMENTS CONSTRUCTION 2021 UFPConstruction.com |
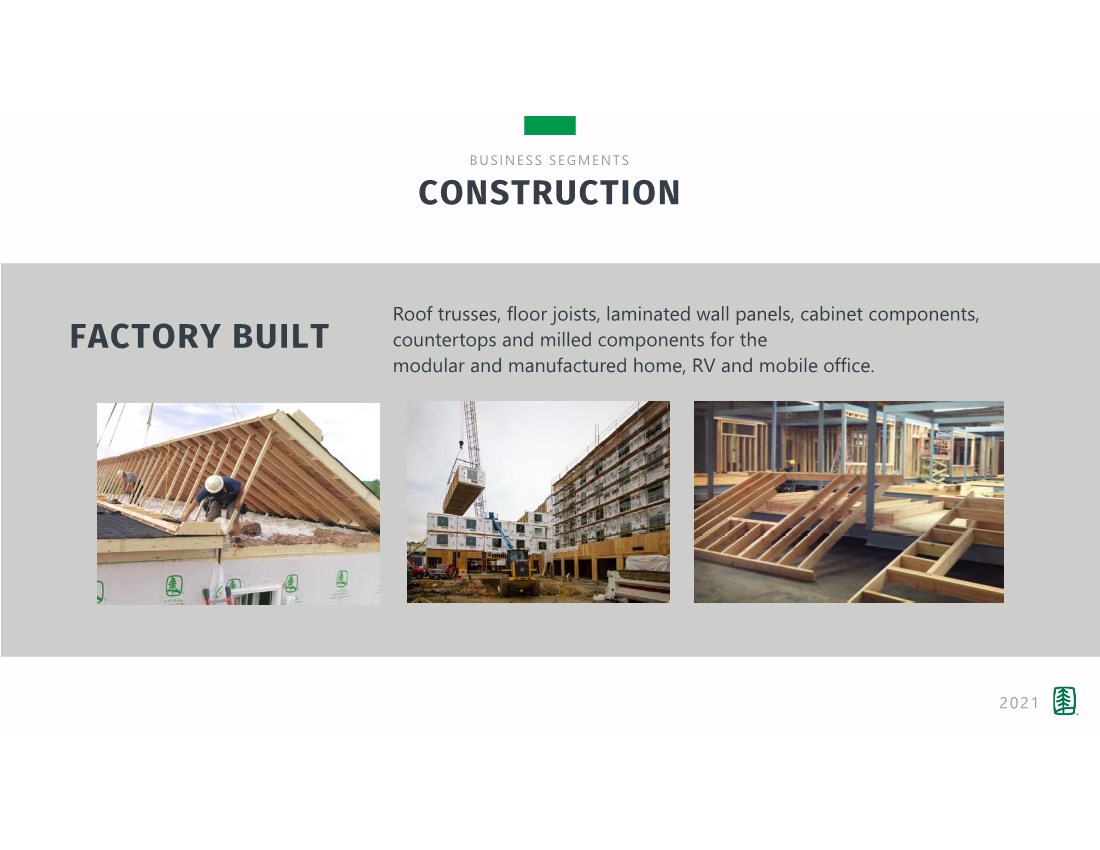
| 18 FACTORY BUILT Roof trusses, floor joists, laminated wall panels, cabinet components, countertops and milled components for the modular and manufactured home, RV and mobile office. BUSINESS SEGMENTS CONSTRUCTION 2021 |
| 19 CONCRETE FORMING BUSINESS SEGMENTS CONSTRUCTION Custom radius forms, wall and column forms, gang systems, lumber and panels. 2021 |

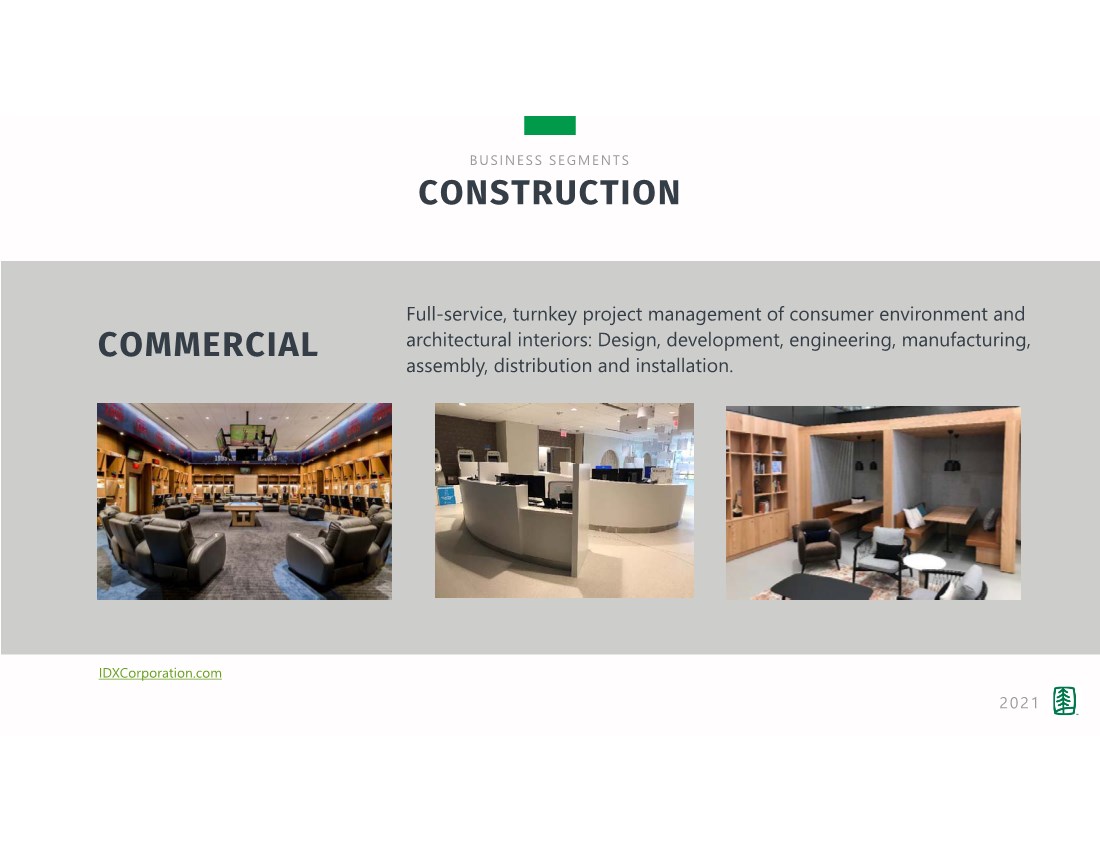
| 20 Full-service, turnkey project management of consumer environment and architectural interiors: Design, development, engineering, manufacturing, assembly, distribution and installation. BUSINESS SEGMENTS CONSTRUCTION COMMERCIAL IDXCorporation.com 2021 |
| 21 PP Delivering innovative structural packaging solutions backed by the industry’s leading design team, a global manufacturing footprint, and integrated hyper-responsive service teams. BUSINESS SEGMENTS INDUSTRIAL • INDUSTRIAL PACKAGING • PACKAGING MATERIALS • MANUFACTURED COMPONENTS 2021 Focus Areas: UFPindustial.com |
| 22 Wood, steel and mixed material crates and specialty containers, hard cases, tracking technology, logistics solutions and onsite packaging services. BUSINESS SEGMENTS INDUSTRIAL INDUSTRIAL PACKAGING 2021 |

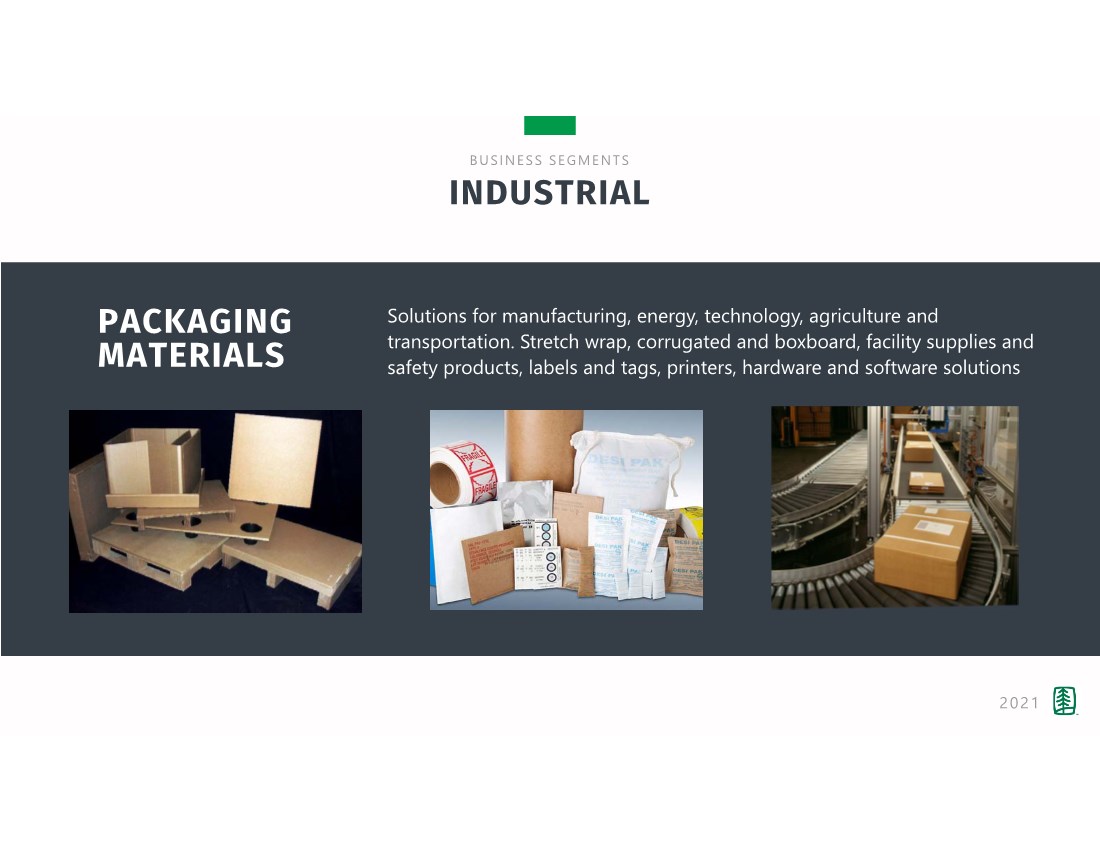
| 23 Solutions for manufacturing, energy, technology, agriculture and transportation. Stretch wrap, corrugated and boxboard, facility supplies and safety products, labels and tags, printers, hardware and software solutions BUSINESS SEGMENTS INDUSTRIAL 2021 PACKAGING MATERIALS |
| 24 Precision-milled hardwoods, softwoods, composites and panel goods for bed foundations; cabinet components; shed, door and window companies. Laminated panels for a variety of industries. BUSINESS SEGMENTS INDUSTRIAL MANUFACTURED COMPONENTS 2021 |

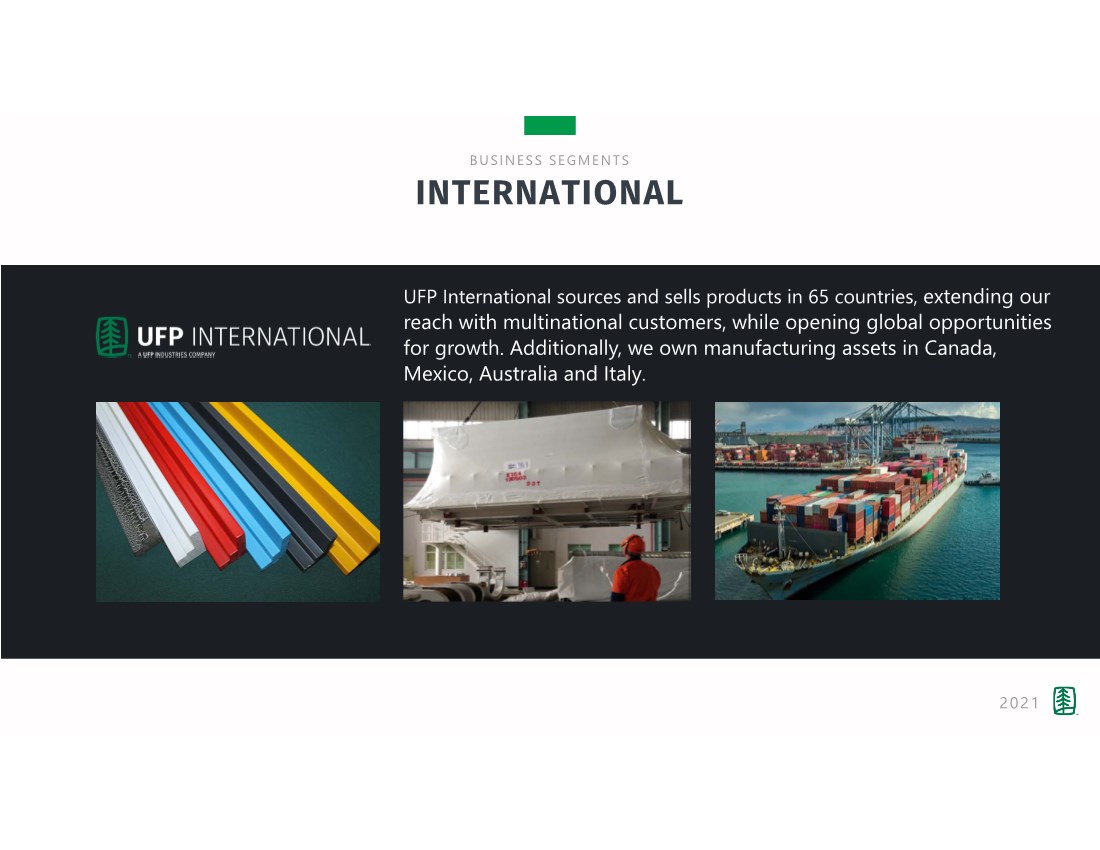
| 25 UFP International sources and sells products in 65 countries, extending our reach with multinational customers, while opening global opportunities for growth. Additionally, we own manufacturing assets in Canada, Mexico, Australia and Italy. BUSINESS SEGMENTS INTERNATIONAL 2021 |
| 26 BUSINESS MODEL ACQUISITIONS 2021 PROCESS Identify attractive growth runways in each Business Unit under each Business Segment and identify gaps in our capabilities to pursue those runways. PURPOSE Find new products and services to continue our transformation from commodity sales to value-added selling solutions and brands. GOAL Achieve scale and synergy targets to optimize growth, margins and returns. |

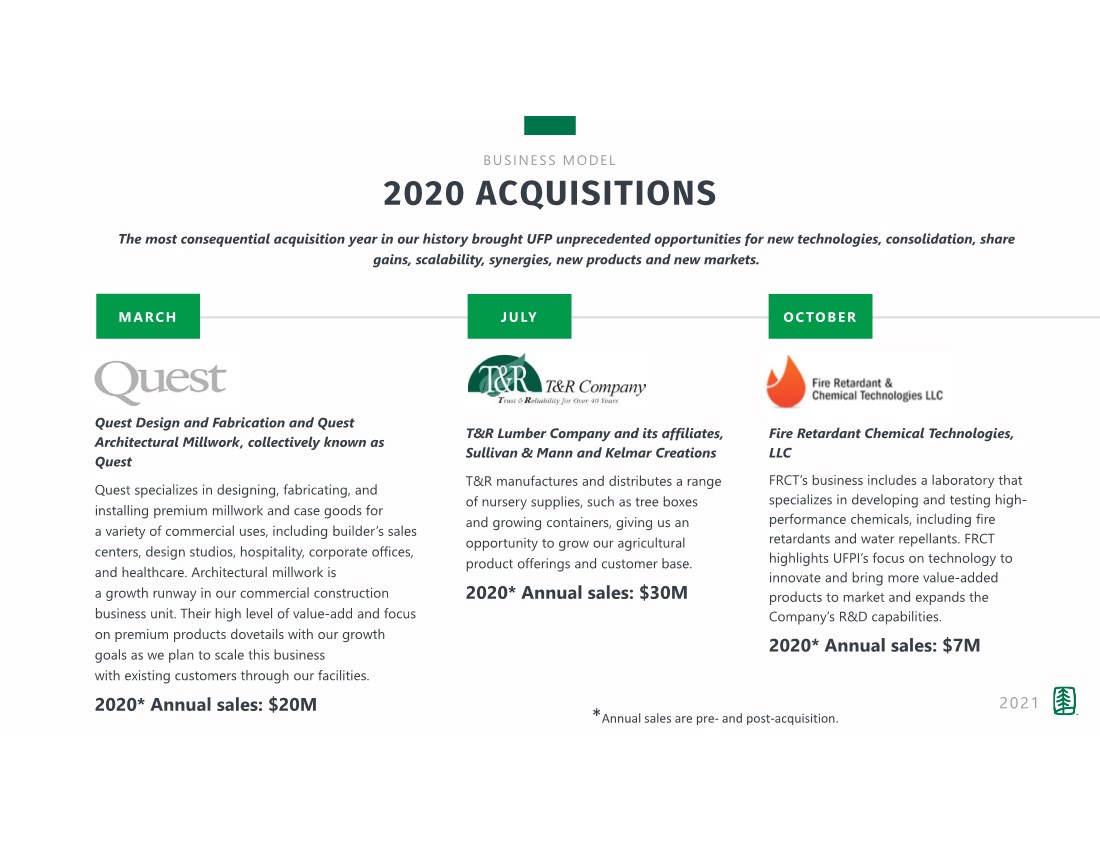
| 27 BUSINESS MODEL 2020 ACQUISITIONS 2021 Quest Design and Fabrication and Quest Architectural Millwork, collectively known as Quest Quest specializes in designing, fabricating, and installing premium millwork and case goods for a variety of commercial uses, including builder’s sales centers, design studios, hospitality, corporate offices, and healthcare. Architectural millwork is a growth runway in our commercial construction business unit. Their high level of value-add and focus on premium products dovetails with our growth goals as we plan to scale this business with existing customers through our facilities. 2020* Annual sales: $20M MARCH JULY OCTOBER T&R Lumber Company and its affiliates, Sullivan & Mann and Kelmar Creations T&R manufactures and distributes a range of nursery supplies, such as tree boxes and growing containers, giving us an opportunity to grow our agricultural product offerings and customer base. 2020* Annual sales: $30M Fire Retardant Chemical Technologies, LLC FRCT’s business includes a laboratory that specializes in developing and testing high- performance chemicals, including fire retardants and water repellants. FRCT highlights UFPI’s focus on technology to innovate and bring more value-added products to market and expands the Company’s R&D capabilities. 2020* Annual sales: $7M The most consequential acquisition year in our history brought UFP unprecedented opportunities for new technologies, consolidation, share gains, scalability, synergies, new products and new markets. *Annual sales are pre‐ and post‐acquisition. |
| 28 BUSINESS MODEL 2020 ACQUISITIONS 2021 Enwrap Logistic & Packaging S.r.l. This newly formed company is dedicated to the logistics and packaging business of its predecessor, Job Service S.p.A. Headquartered in Milan, Italy, Enwrap provides high-value, mixed material industrial packaging and logistics services through five locations in Italy, allowing UFP to establish its presence in the region and to serve customers in Central and Southern Europe. 2020* Annual sales: $14M OCTOBER NOVEMBER Atlantic Prefab, Inc.; Exterior Designs, LLC; and Patriot Building Systems, LLC These three companies serve the commercial and multi-family construction markets in the Northeast with prefabricated steel wall panels, light gauge metal trusses, exterior cladding, exterior insulation and finish systems and commercial and multi-family framing services. With them, UFPI brings more value-added products and services to its construction customers. 2020* Annual combined sales: $30M *Annual sales are pre‐ and post‐acquisition. |

| 29 BUSINESS MODEL 2021 ACQUISITIONS 2021 PalletOne, Inc. PalletOne is the leading manufacturer of new pallets in the U.S., with 17 manufacturing facilities and 1,500 employees in the Southern and Eastern regions of the U.S. The company also supplies specialized industrial packaging, including custom bins and crates, and its Sunbelt Forest Products subsidiary operates five pressure- treating facilities in the Southeastern U.S. 2020 Annual combined sales: $698M ($267M for PalletOne, $431M for Sunbelt) This acquisition expands UFPI’s capacity, capabilities and customer base, bolsters our position as the leading wood preserver in the United States, and moves us closer to our goal of becoming the preferred global packaging solutions provider. FISCAL JANUARY |

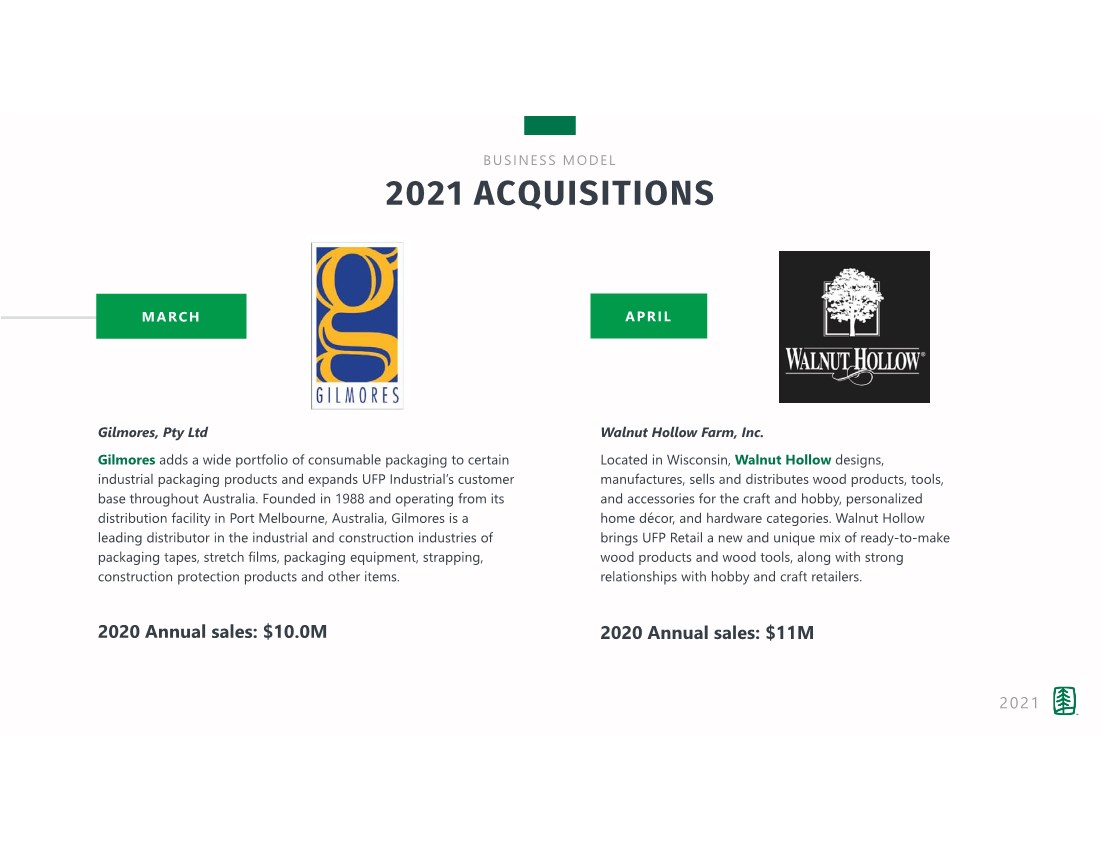
| 30 BUSINESS MODEL 2021 ACQUISITIONS 2021 Gilmores, Pty Ltd Gilmores adds a wide portfolio of consumable packaging to certain industrial packaging products and expands UFP Industrial’s customer base throughout Australia. Founded in 1988 and operating from its distribution facility in Port Melbourne, Australia, Gilmores is a leading distributor in the industrial and construction industries of packaging tapes, stretch films, packaging equipment, strapping, construction protection products and other items. 2020 Annual sales: $10.0M Walnut Hollow Farm, Inc. Located in Wisconsin, Walnut Hollow designs, manufactures, sells and distributes wood products, tools, and accessories for the craft and hobby, personalized home décor, and hardware categories. Walnut Hollow brings UFP Retail a new and unique mix of ready-to-make wood products and wood tools, along with strong relationships with hobby and craft retailers. 2020 Annual sales: $11M MARCH APRIL |
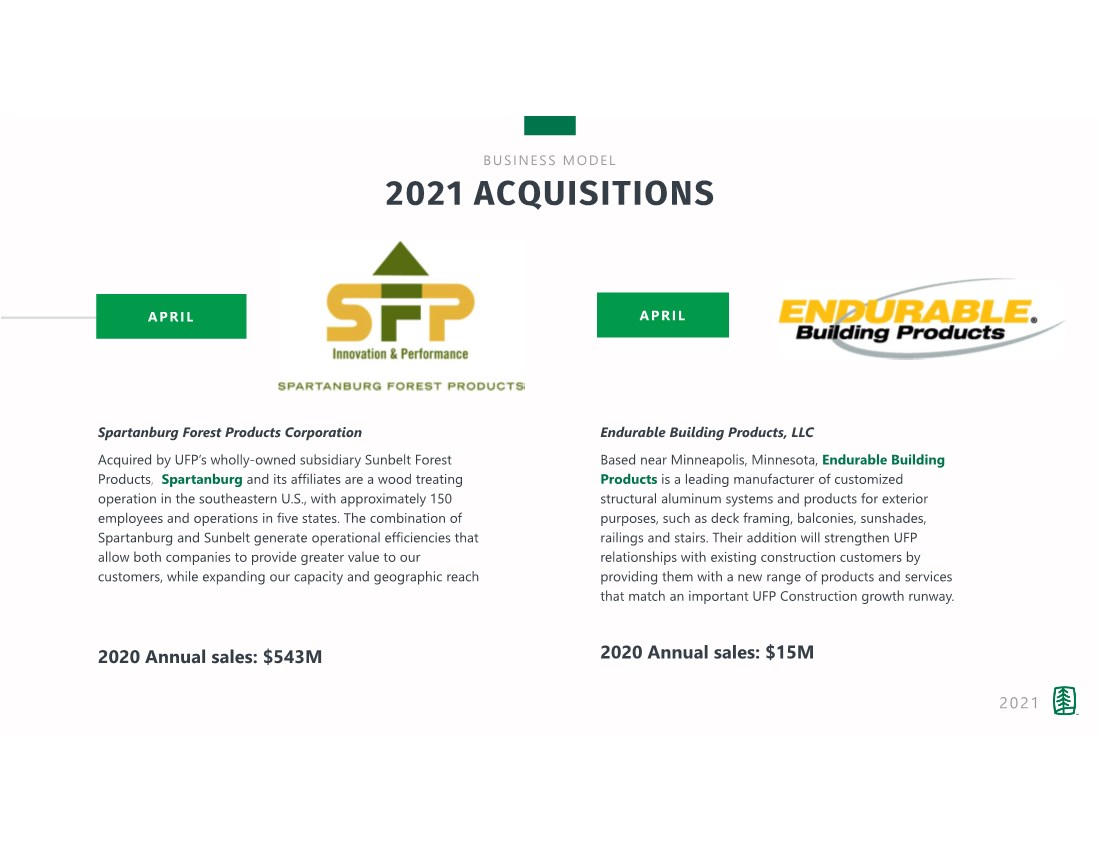
| 31 BUSINESS MODEL 2021 ACQUISITIONS 2021 Spartanburg Forest Products Corporation Acquired by UFP’s wholly-owned subsidiary Sunbelt Forest Products, Spartanburg and its affiliates are a wood treating operation in the southeastern U.S., with approximately 150 employees and operations in five states. The combination of Spartanburg and Sunbelt generate operational efficiencies that allow both companies to provide greater value to our customers, while expanding our capacity and geographic reach 2020 Annual sales: $543M Endurable Building Products, LLC Based near Minneapolis, Minnesota, Endurable Building Products is a leading manufacturer of customized structural aluminum systems and products for exterior purposes, such as deck framing, balconies, sunshades, railings and stairs. Their addition will strengthen UFP relationships with existing construction customers by providing them with a new range of products and services that match an important UFP Construction growth runway. 2020 Annual sales: $15M APRIL APRIL |
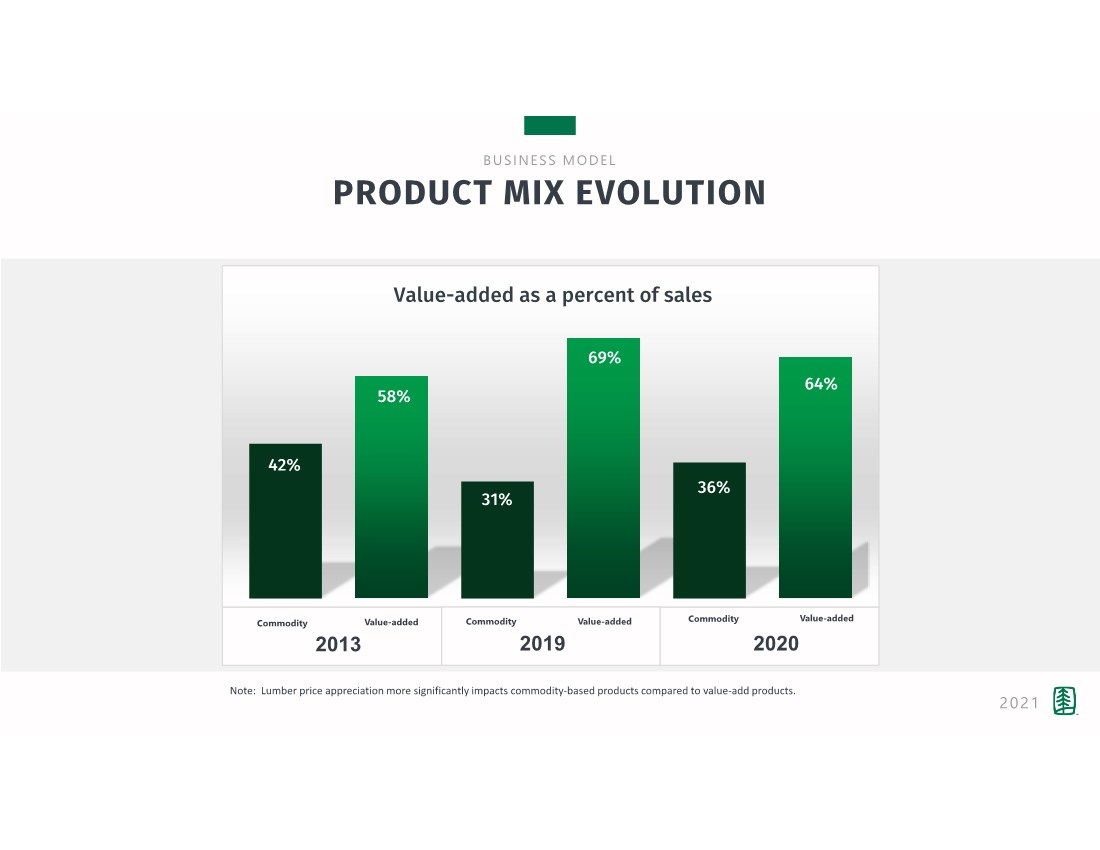
| 32 BUSINESS MODEL PRODUCT MIX EVOLUTION 2013 31% 58% 69% 42% Commodity Value-added as a percent of sales 2021 Value-added 2019 Commodity Value-added 2020 Commodity Value-added 64% 36% 2013 Note: Lumber price appreciation more significantly impacts commodity‐based products compared to value‐add products. |
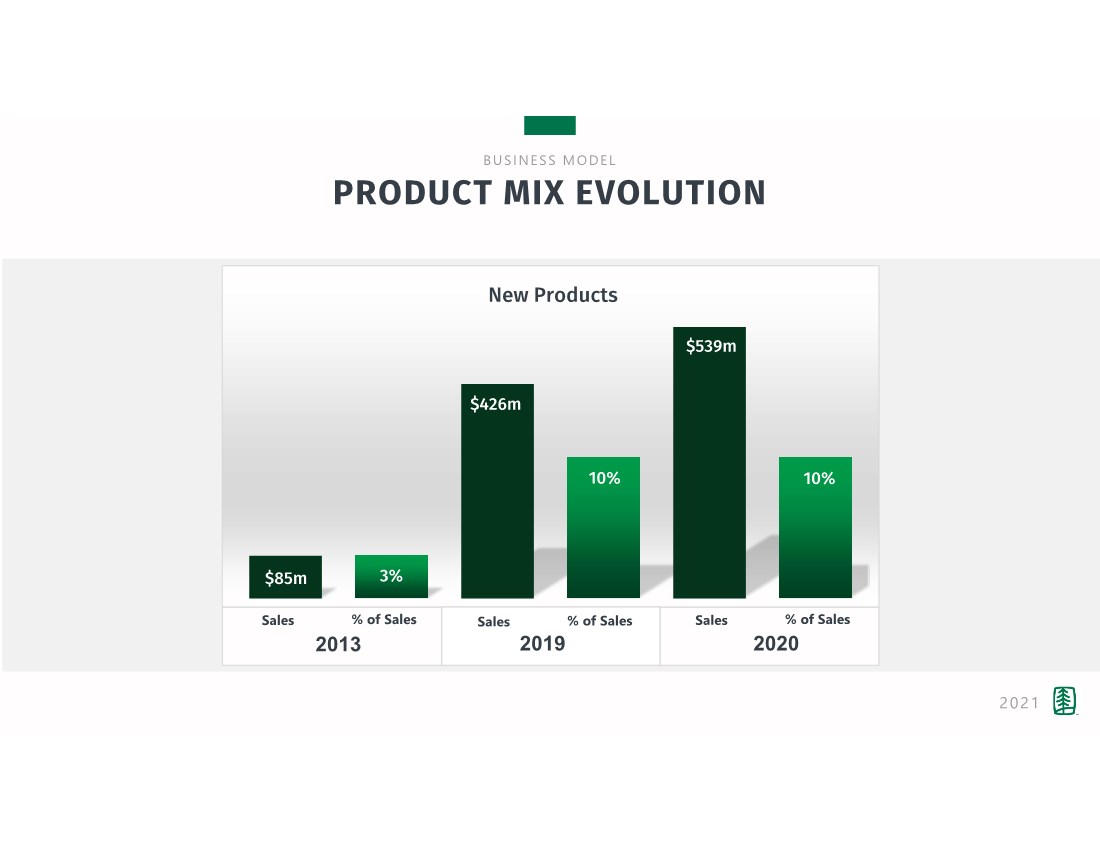
| 33 BUSINESS MODEL PRODUCT MIX EVOLUTION 2013 $426m 3% 10% $85m New Products 2021 2019 2020 10% $539m 2013 % of Sales Sales % of Sales Sales % of Sales Sales |
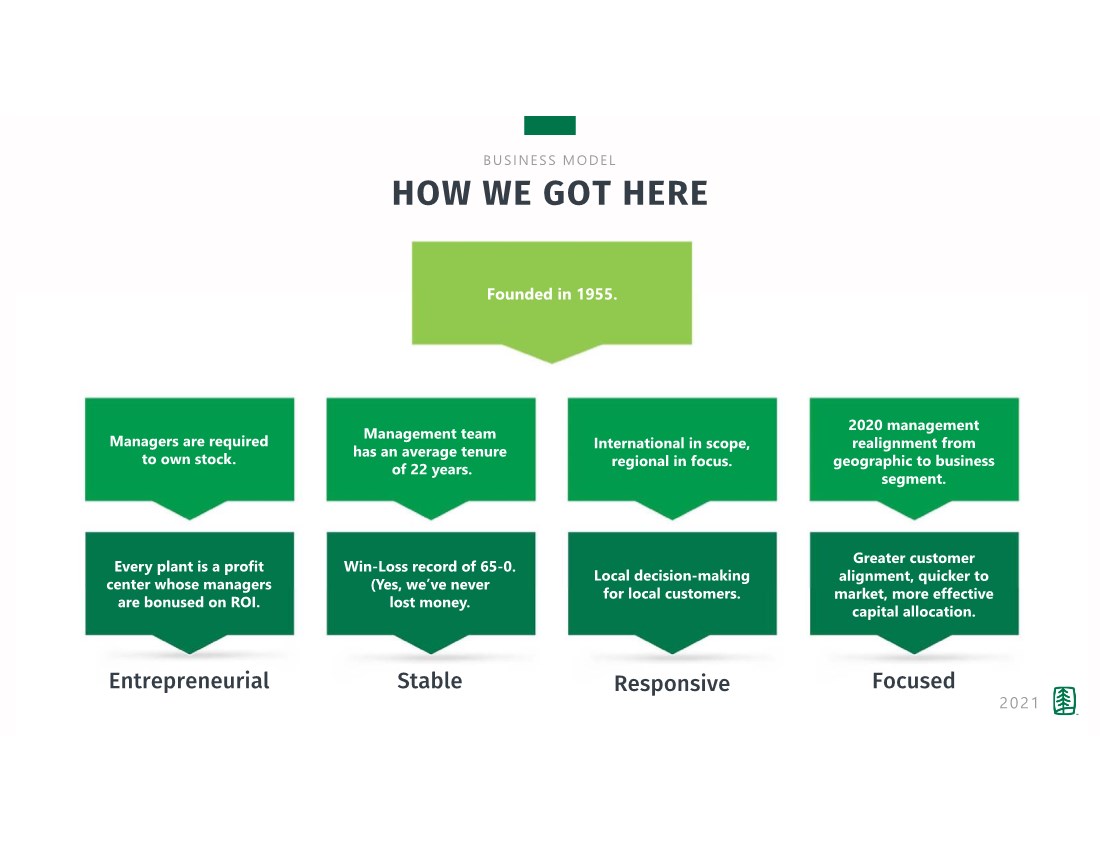
| 34 BUSINESS MODEL HOW WE GOT HERE 2021 Founded in 1955. Managers are required to own stock. Management team has an average tenure of 22 years. 2020 management realignment from geographic to business segment. International in scope, regional in focus. Local decision-making for local customers. Win-Loss record of 65-0. (Yes, we’ve never lost money. Every plant is a profit center whose managers are bonused on ROI. Greater customer alignment, quicker to market, more effective capital allocation. Entrepreneurial Stable Responsive Focused |
| 35 BUSINESS MODEL WHAT GETS IN OUR WAY Availability of quality labor General economic trends Fluctuation in commodity lumber costs Regulatory burdens 2021 |

| 36 BUSINESS MODEL LONG-TERM FINANCIAL GOALS 2021 Annual unit sales growth that exceeds positive U.S. GDP growth by 4-6 percentage points including acquisitions Adjusted EBITDA growth exceeding unit sales growth Earn ROIC greater than WACC |

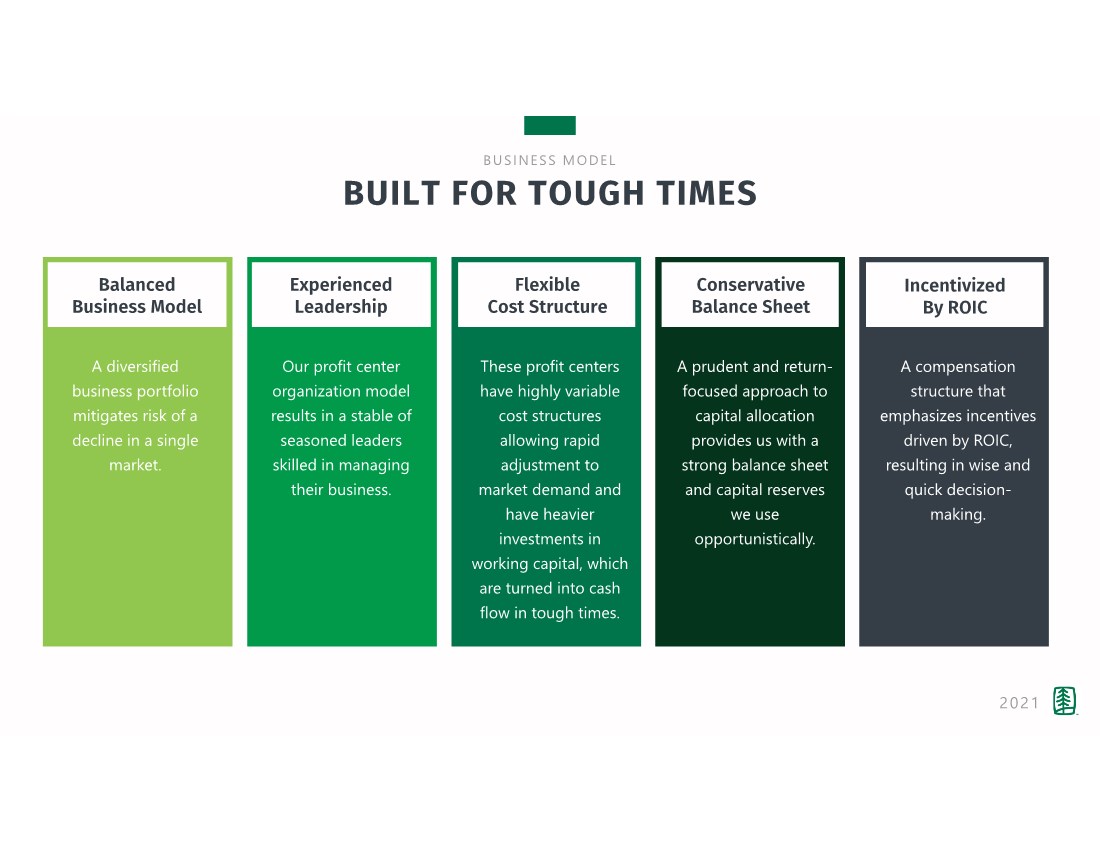
| 37 Experienced Leadership BUSINESS MODEL BUILT FOR TOUGH TIMES 2021 Our profit center organization model results in a stable of seasoned leaders skilled in managing their business. These profit centers have highly variable cost structures allowing rapid adjustment to market demand and have heavier investments in working capital, which are turned into cash flow in tough times. A prudent and return- focused approach to capital allocation provides us with a strong balance sheet and capital reserves we use opportunistically. A compensation structure that emphasizes incentives driven by ROIC, resulting in wise and quick decision- making. Balanced Business Model Flexible Cost Structure Conservative Balance Sheet Incentivized By ROIC A diversified business portfolio mitigates risk of a decline in a single market. |
| 38 FINANCIALS |

| 39 BUSINESS MODEL LUMBER MARKET IMPACT ON OPERATING RESULTS Goal: to earn a stable profit per unit 2021 We are less affected by the level of lumber prices than the primary producers of lumber are Level of lumber prices affects gross profit and SG&A to sales ratios Profit per unit is primarily impacted by the trend and volatility of the market Balance in business and risk management techniques mitigate impact on profitability |

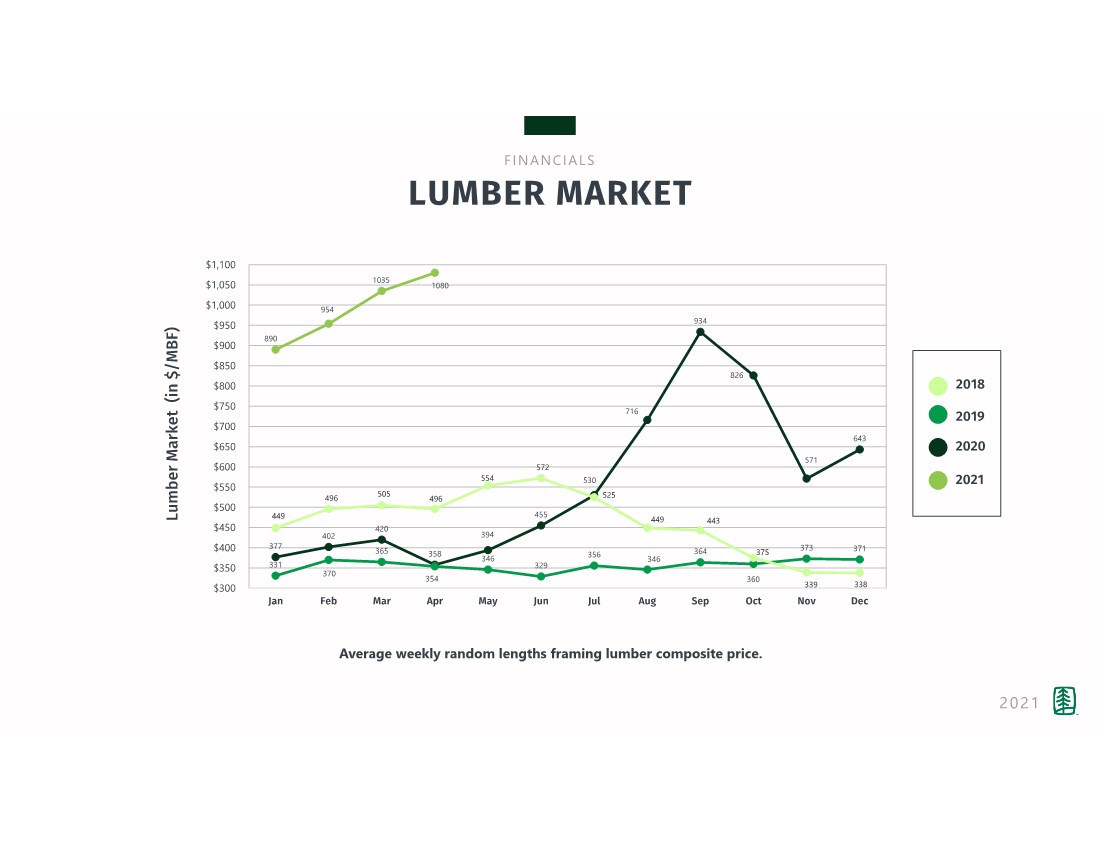
| 40 890 954 1035 1080 377 402 420 358 394 455 530 716 934 826 571 643 331 370 365 354 346 329 356 346 364 360 373 371 449 496 505 496 554 572 525 449 443 375 339 338 $300 $350 $400 $450 $500 $550 $600 $650 $700 $750 $800 $850 $900 $950 $1,000 $1,050 $1,100 Jan Feb Mar Apr May Jun Jul Aug Sep Oct Nov Dec FINANCIALS LUMBER MARKET 2021 Lumber Market (in $/MBF) Average weekly random lengths framing lumber composite price. 2020 2019 2018 2021 |
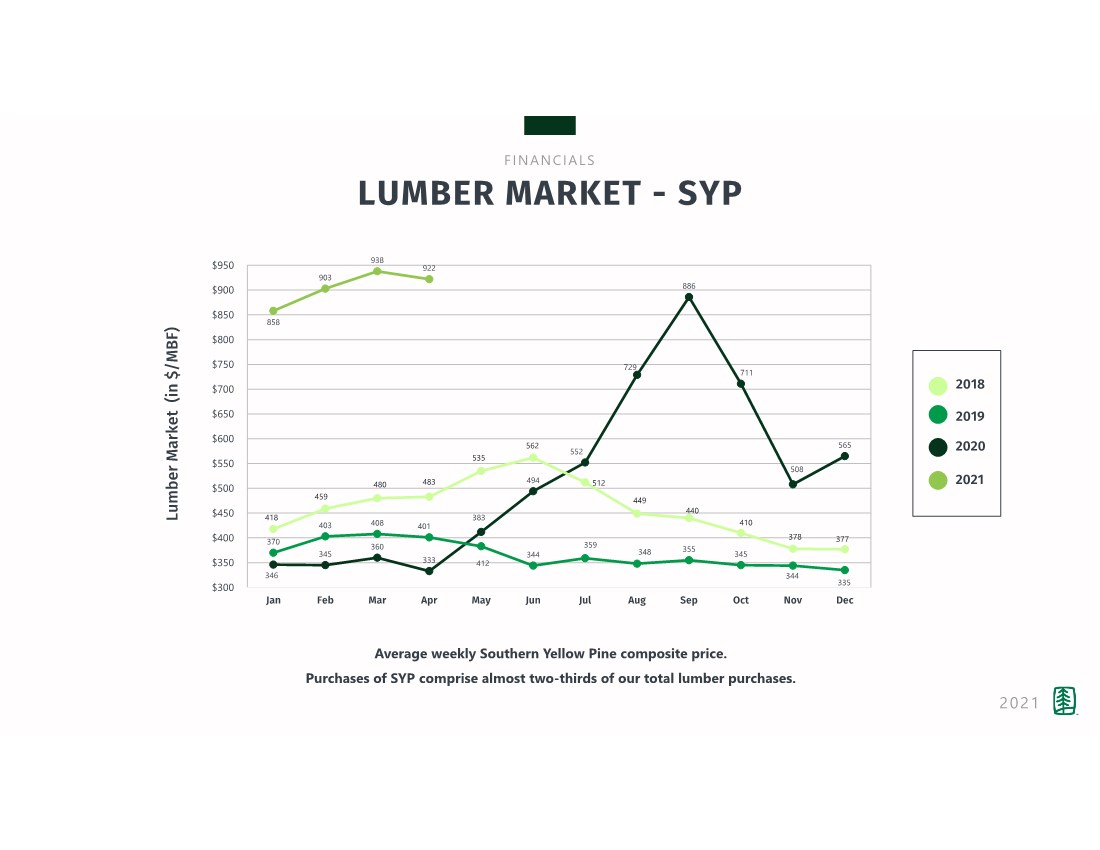
| 41 FINANCIALS LUMBER MARKET - SYP 2021 858 903 938 922 346 345 360 333 412 494 552 729 886 711 508 565 370 403 408 401 383 344 359 348 355 345 344 335 418 459 480 483 535 562 512 449 440 410 378 377 $300 $350 $400 $450 $500 $550 $600 $650 $700 $750 $800 $850 $900 $950 Jan Feb Mar Apr May Jun Jul Aug Sep Oct Nov Dec Lumber Market (in $/MBF) Average weekly Southern Yellow Pine composite price. Purchases of SYP comprise almost two-thirds of our total lumber purchases. 2020 2019 2018 2021 |
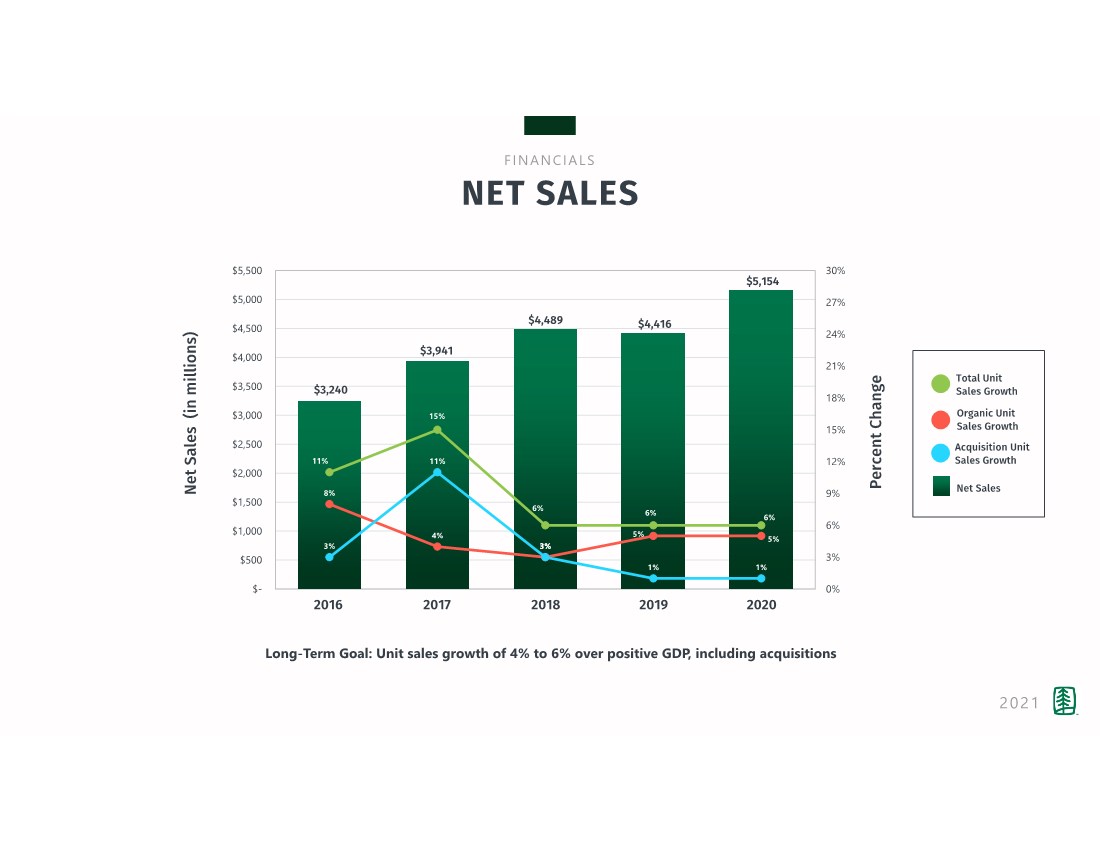
| 42 FINANCIALS 2021 NET SALES Long-Term Goal: Unit sales growth of 4% to 6% over positive GDP , including acquisitions Net Sales (in millions) Percent Change $3,240 $3,941 $4,489 $4,416 $5,154 11% 15% 6% 6% 6% 8% 4% 3% 5% 5% 3% 11% 3% 1% 1% 0% 3% 6% 9% 12% 15% 18% 21% 24% 27% 30% $- $500 $1,000 $1,500 $2,000 $2,500 $3,000 $3,500 $4,000 $4,500 $5,000 $5,500 Acquisition Unit Sales Growth Organic Unit Sales Growth Total Unit Sales Growth Net Sales 2016 2017 2018 2019 2020 |
| 43 FINANCIALS UNIT SALES AND PROFIT GROWTH 2021 Percent Growth 11% 15% 14% 6% 6% 19% 14% 15% 16% 17% 18% 13% 12% 19% 36% 0% 5% 10% 15% 20% 25% 30% 35% 40% 2016 2017 2018 2019 2020 Long-Term Goal: Achieve Adjusted EBITDA growth exceeding unit sales growth. Unit Sales Growth Gross Profit Growth Adjusted EBITDA Growth |

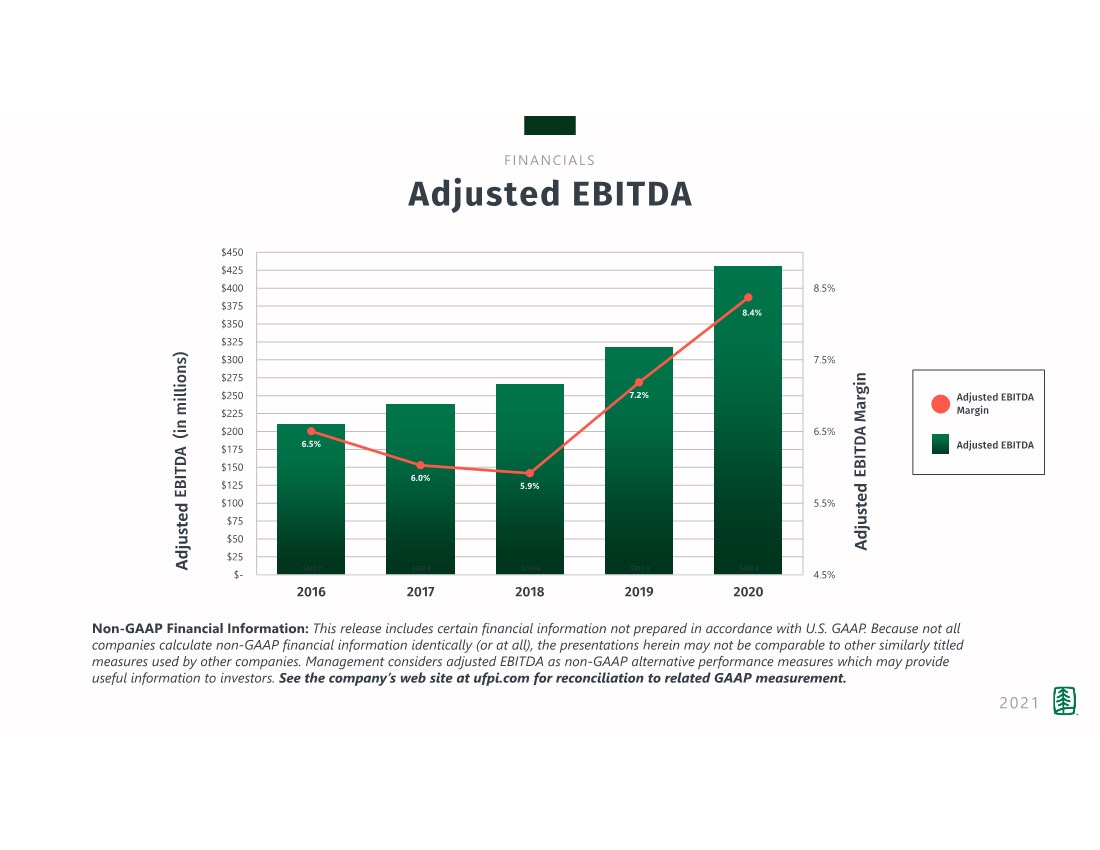
| 44 FINANCIALS Adjusted EBITDA 2021 Non-GAAP Financial Information: This release includes certain financial information not prepared in accordance with U.S. GAAP. Because not all companies calculate non-GAAP financial information identically (or at all), the presentations herein may not be comparable to other similarly titled measures used by other companies. Management considers adjusted EBITDA as non-GAAP alternative performance measures which may provide useful information to investors. See the company’s web site at ufpi.com for reconciliation to related GAAP measurement. EBITDA (in millions) EBITDA Margin Adjusted EBITDA Margin Adjusted EBITDA Adjusted Adjusted $210.7 $237.6 $265.6 $317.3 $431.4 6.5% 6.0% 5.9% 7.2% 8.4% 4.5% 5.5% 6.5% 7.5% 8.5% $- $25 $50 $75 $100 $125 $150 $175 $200 $225 $250 $275 $300 $325 $350 $375 $400 $425 $450 2016 2017 2018 2019 2020 |
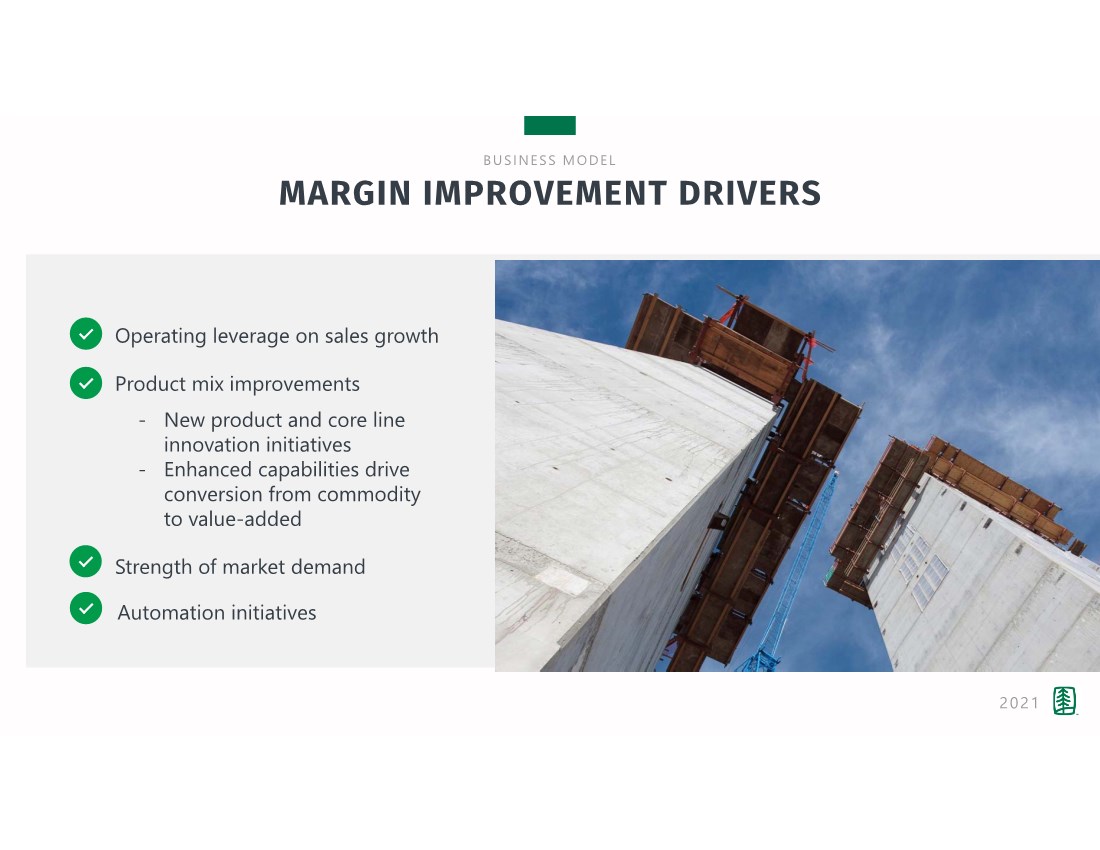
| 45 BUSINESS MODEL MARGIN IMPROVEMENT DRIVERS 2021 Operating leverage on sales growth Product mix improvements - New product and core line innovation initiatives - Enhanced capabilities drive conversion from commodity to value-added Strength of market demand Automation initiatives |
| 46 FINANCIALS RETURN ON INVESTED CAPITAL 2021 Hurdle Rate = 12% 10% WACC and Minimum ROIC Goal (1) See the company’s website at ufpi.com for reconciliation to related GAAP measurement. Percent 13.7% 13.2% 14.0% 15.1% 21.0% 0.00% 3.00% 6.00% 9.00% 12.00% 15.00% 18.00% 21.00% 24.00% 2016 2017 2018 2019 2020 |

| 47 FINANCIALS CASH CYCLE 2021 Cash Cycle = Days Receivables Outstanding + Days Supply of Inventory – Days Payables Outstanding Days 47.9 52.4 54.1 55.7 48.1 0 10 20 30 40 50 60 70 2016 2017 2018 2019 2020 |

| 48 FINANCIALS NET DEBT 2021 $ In thousands Mar-21 Dec-20 Dec-19 Dec-18 3.89% series 2012 - A notes, Tranche A, due December 2022 $ 35,000 $ 35,000 $ 35,000 $ 35,000 3.98% series 2012 - B notes, Tranche B, due December 2024 40,000 40,000 40,000 40,000 4.20% series 2018 - C notes, Tranche C, due June 2028 40,000 40,000 40,000 40,000 4.27% series 2018 - D notes, Tranche D, due June 2030 35,000 35,000 35,000 35,000 3.04% series 2020 - E notes, Tranche E, due August 2032 50,000 50,000 - - 3.08% series 2020 - F notes, Tranche F, due August 2033 50,000 50,000 - - 3.15% series 2020 - G notes, Tranche G, due August 2035 50,000 50,000 - - Revolving credit facility ($550 million total available) 119,429 4,715 3,976 42,490 Industrial Development Revenue Bonds 7,000 7,000 9,700 9,700 Other (9) (8) 8 88 Less Cash Surplus (44,399) (436,507) (168,336) (27,316) Plus Cash Overdraft 47,140 - - 27,367 Total Net Debt (Surplus Cash) $ 429,161 $ (124,800) $ (4,652) $ 202,329 Unused debt capacity (1) $ 475,000 Total Liquidity $ 420,800 (1) 1.75X TTM adjusted EBITDA less net debt |

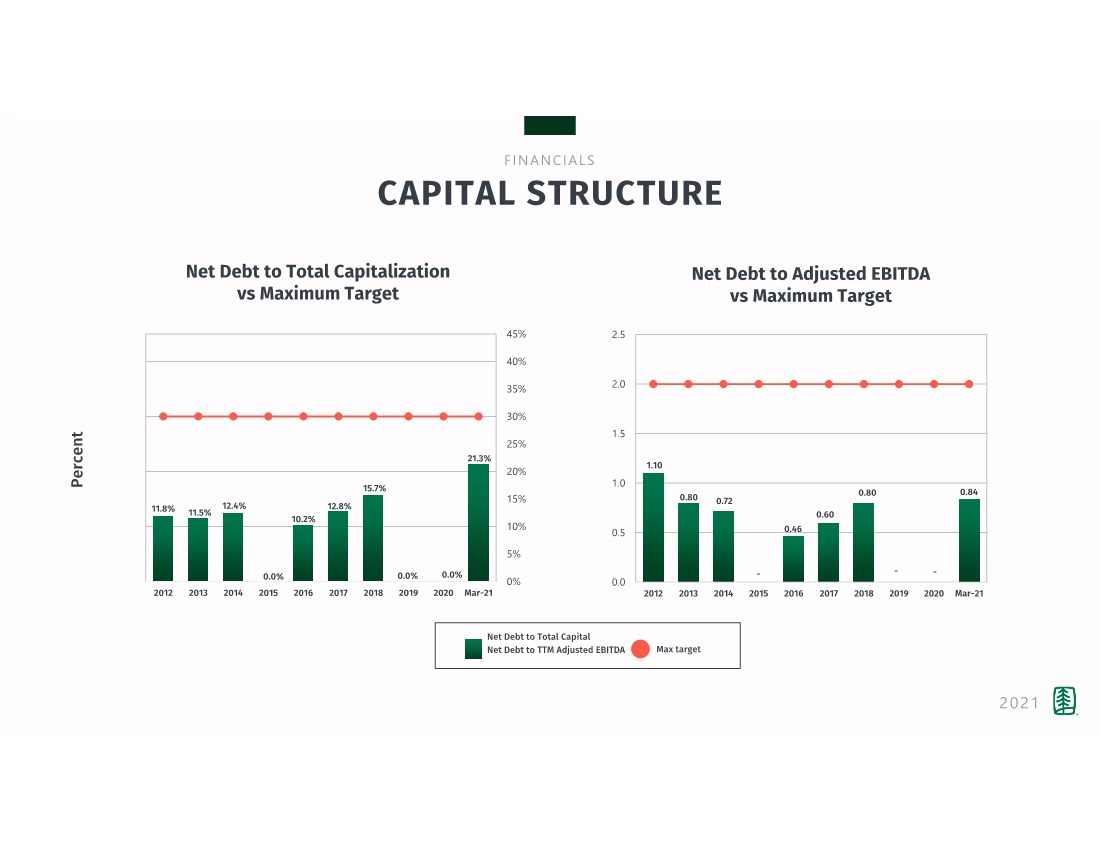
| 49 FINANCIALS CAPITAL STRUCTURE 2021 Percent Net Debt to Total Capitalization vs Maximum Target Net Debt to Adjusted EBITDA vs Maximum Target 11.8% 11.5% 12.4% 0.0% 10.2% 12.8% 15.7% 0.0% 0.0% 21.3% 0% 5% 10% 15% 20% 25% 30% 35% 40% 45% 2012 2013 2014 2015 2016 2017 2018 2019 2020 Mar-21 1.10 0.80 0.72 - 0.46 0.60 0.80 - - 0.84 0.0 0.5 1.0 1.5 2.0 2.5 2012 2013 2014 2015 2016 2017 2018 2019 2020 Mar-21 Max target Net Debt to Total Capital Net Debt to TTM Adjusted EBITDA |
| 50 BUSINESS MODEL BALANCED USE OF FREE CASH FLOW 2021 Current dividend rate of $0.15/quarter, increased annually based on earnings and free cash flow growth Share repurchases totaled over $29M in 2020 (1.1M remaining share authorization) CapEx plan of $115M in 2021 Long-term target for acquisitions to contribute half of our total annual unit sales growth |

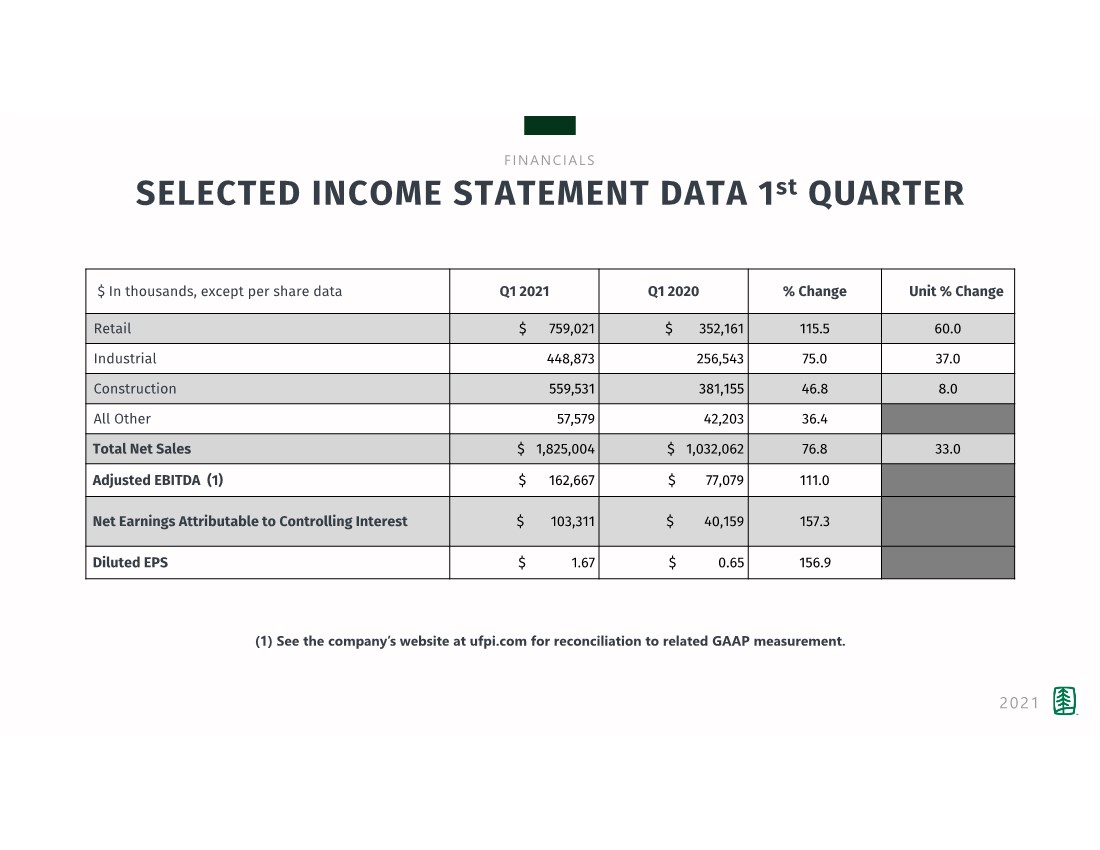
| 51 FINANCIALS SELECTED INCOME STATEMENT DATA 1st QUARTER 2021 (1) See the company’s website at ufpi.com for reconciliation to related GAAP measurement. $ In thousands, except per share data Q1 2021 Q1 2020 % Change Unit % Change Retail $ 759,021 $ 352,161 115.5 60.0 Industrial 448,873 256,543 75.0 37.0 Construction 559,531 381,155 46.8 8.0 All Other 57,579 42,203 36.4 Total Net Sales $ 1,825,004 $ 1,032,062 76.8 33.0 Adjusted EBITDA (1) $ 162,667 $ 77,079 111.0 Net Earnings Attributable to Controlling Interest $ 103,311 $ 40,159 157.3 Diluted EPS $ 1.67 $ 0.65 156.9 |
| 52 FINANCIALS SELECTED INCOME STATEMENT DATA ANNUAL RESULTS 2021 $ In thousands, except per share data 2020 2019 % Change Unit % Change Retail $ 2,167,122 $ 1,498,710 44.6 25.0 Industrial 1,072,117 1,085,636 -1.2 -6.0 Construction 1,695,683 1,637,156 3.6 -6.0 All Other 219,076 194,507 12.6 Total Net Sales $ 5,153,998 $ 4,416,009 16.7 6.0 Adjusted EBITDA (1) $ 431,361 $ 317,297 35.9 Net Earnings Attributable to Controlling Interest $ 246,778 $ 179,650 37.4 Diluted EPS $ 4.00 $ 2.91 37.5 (1) See the company’s website at ufpi.com for reconciliation to related GAAP measurement. |

| 53 2801 E. Beltline Ave. NE Grand Rapids, MI 49506 (800) 598-9663 - UFPI.com THANK YOU. |
