UNITED STATES
SECURITIES AND EXCHANGE COMMISSION
Washington, D.C. 20549
FORM
CURRENT REPORT
Pursuant to Section 13 OR 15(d) of the Securities Exchange Act of 1934
Date of Report (Date of earliest event reported):
(Exact name of registrant as specified in its charter)
Registrant's telephone number, including area code: (
None
(Former name or former address, if changed since last report)
Check the appropriate box below if the Form 8-K filing is intended to simultaneously satisfy the filing obligation of the registrant under any of the following provisions:
Securities registered pursuant to Section 12(b) of the Act:
Title of each class | Trading Symbol(s) | Name of each exchange on which registered |
The |
Indicate by check mark whether the registrant is an emerging growth company as defined in Rule 405 of the Securities Act of 1933 (§230.405 of this chapter) or Rule 12b-2 of the Securities Exchange Act of 1934 (§240.12b-2 of this chapter).
Emerging growth company
If an emerging growth company, indicate by check mark if the registrant has elected not to use the extended transition period for complying with any new or revised financial accounting standards provided pursuant to Section 13(a) of the Exchange Act. ☐
Item 7.01. Regulation FD Disclosure.
Attached as Exhibit 99.1 is the Company's current version of its 2022 Investor Relations Presentation provided to investors.
The information in this Form 8-K and the attached Exhibit shall not be deemed filed for purposes of Section 18 of the Securities Exchange Act of 1934, as amended, nor shall they be deemed incorporated by reference in any filing under the Securities Act of 1933, as amended.
Item 9.01. Exhibits.
Exhibits
99.1 | |
104 | Cover Page Interactive File (the cover page XBRL tags are embedded in the Inline XBRL document). |
2
SIGNATURE
Pursuant to the requirements of the Securities Exchange Act of 1934, the registrant has duly caused this report to be signed on its behalf by the undersigned thereunto duly authorized.
Dated: June 8, 2022 | UFP INDUSTRIES, INC. | |
(Registrant) | ||
By: | /s/ Michael R. Cole | |
Michael R. Cole | ||
Principal Financial Officer and Treasurer | ||
3
| 1 NO MISSION STATEMENTS. JUST PEOPLE ON A MISSION. |

| 2 UFP INDUSTRIES, INC. 2022 Please be aware that: Statements included in this presentation that are not historical are forward - looking statements within the meaning of Section 21E of the Securities Exchange Act, as amended, and are based on management’s beliefs, assumptions, current expectations, estimates, and projection s a bout the markets we serve, the economy, and the company itself. Words like “anticipates,” “believes,” “confident,” “estimates,” “expects,” “forecasts,” like ly, ” “plans,” “projects,” “should,” variations of such words, and similar expressions identify such forward - looking statements. These statements do not guarantee future performan ce and involve certain risks, uncertainties and assumptions that are difficult to predict with regard to timing, extent, likelihood and degree of occurrence. The Company does not undertake to update forward - looking statements to reflect facts, circumstances, assumptions or events that occur after the date the forward - l ooking statements are made. Actual results could differ materially from those included in such forward - looking statements. Investors are cautioned that all forward - looking statements involve risks and uncertainty. Among the factors that could cause actual results to differ materially from forward - looking statements are the foll owing: Fluctuations in the price of lumber; adverse or unusual weather conditions; adverse conditions in the markets we serve; government regulations, particular ly involving environmental and safety regulations; and our ability to make successful business acquisitions. Certain of these risk factors as well as other risk facto rs and additional information are included in the Company's reports on Form 10 - K and 10 - Q on file with the Securities and Exchange Commission. Non - GAAP Financial Information: This presentation includes certain financial information not prepared in accordance with U.S. GA AP. Because not all companies calculate non - GAAP financial information identically (or at all), the information herein may not be comparable to other similarl y titled measures used by other companies. Management considers adjusted EBITDA and return on invested capital to be non - GAAP alternative performance measures w hich may provide useful information to investors This presentation is the property of UFP Industries, Inc. Any redistribution, retransmission, or reprinting of this presentation in any form without the express written consent of Universal is strictly prohibited. |
| 3 40% 31% 24% 5% Based on 2021 Sales INTRODUCTION UFP AT A GLANCE Retail - $3.4B Big box, independents, & buying co - ops Construction - $2.7B Single and multi - family builders, commercial builders, concrete formers, factory - built housing (mobile & modular homes) & RVs 2022 Industrial - $2.1B Industrial packaging, packaging materials & OEM components International - $0.4B Overseas sourcing and selling with manufacturing and design assets in nine countries. 15,000+ Number of employees worldwide 208 Number of facilities worldwide $8.6B 2021 Revenue $835M 2021 Adjusted EBITDA 1955 Company founded in Grand Rapids, MI $ |

| 4 INTRODUCTION WHERE WE ARE 2022 183 2 4 1 11 1 5 GLOBAL LOCATIONS 208 1 |
| 5 2022 VALUE - ADDED TRANSFORMATION |
| 6 UFP INDUSTRIES MANAGEMENT (R)EVOLUTION Since our founding through 2019, we managed our people and plants regionally. Beginning January 1, 2020, we realigned our management teams to focus specifically on business segments rather than geographies. At the same time, we changed our name to better reflect the breadth of our product mix. The new structure brought greater focus, resulting in: • Improved alignment with our customers • Faster introduction of new, value - added products • Better, quicker decision making • More effective allocation of capital • More consistent execution Western Division Southern Division Northern Division 2020 and Beyond 1955 - 2019 2020 and Beyond 2022 |

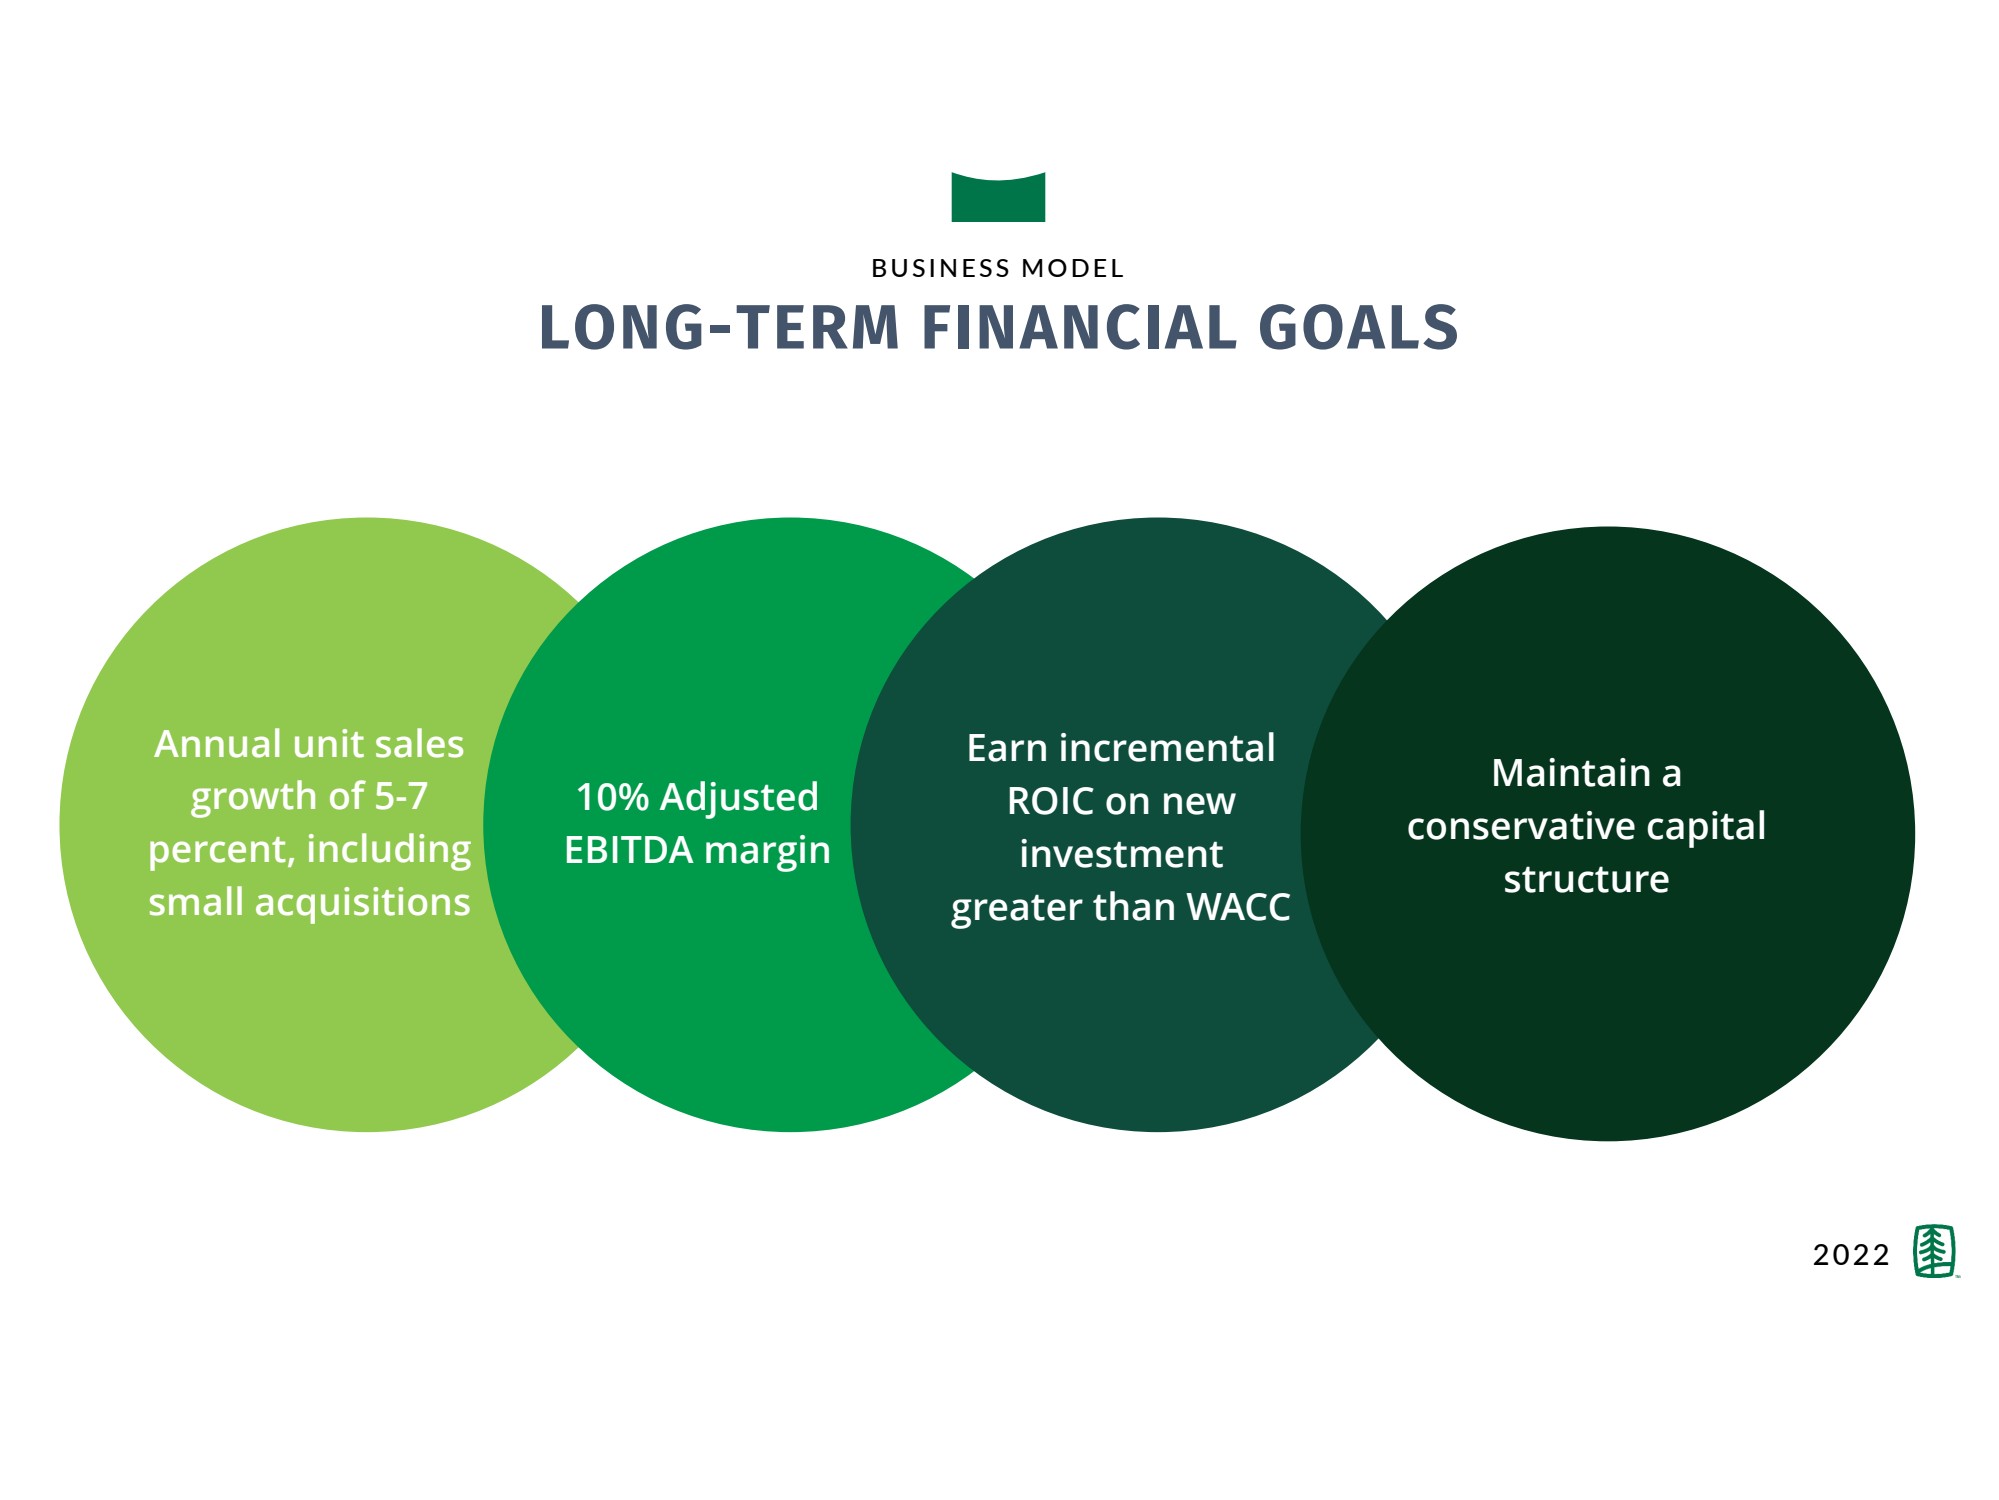
| 7 BUSINESS MODEL LONG - TERM FINANCIAL GOALS 2022 Annual unit sales growth of 5 - 7 percent, including small acquisitions 10% Adjusted EBITDA margin Earn incremental ROIC on new investment greater than WACC Maintain a conservative capital structure |
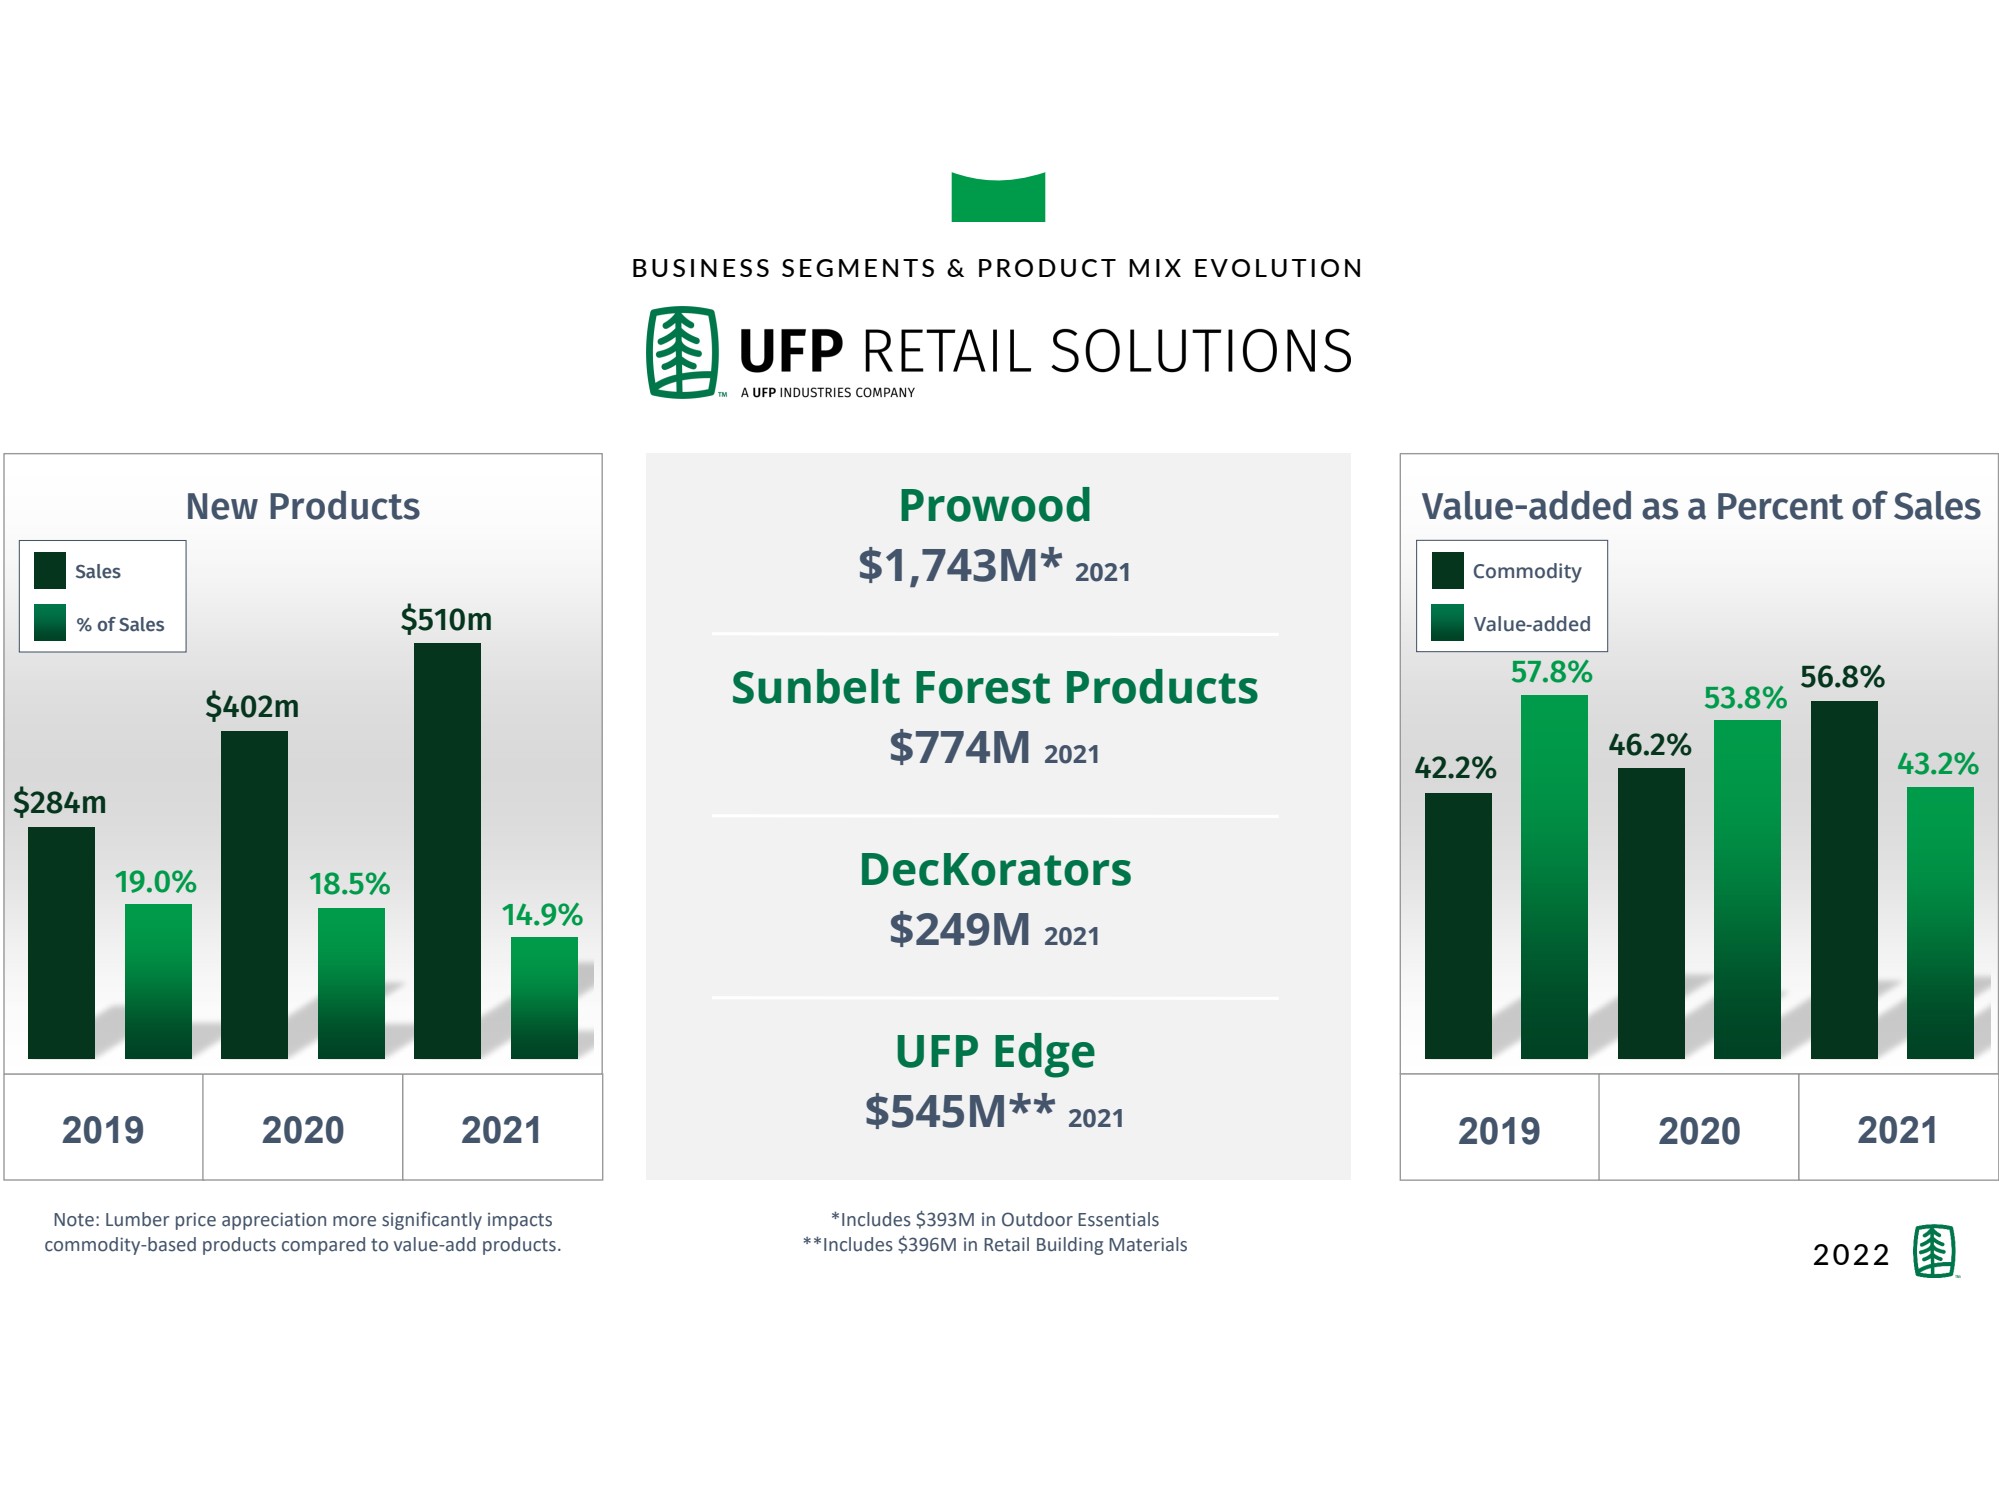
| 8 BUSINESS SEGMENTS & PRODUCT MIX EVOLUTION 2022 2013 Value - added as a Percent of Sales 2013 $284m 19.0% New Products 14.9% $402m $510m 18.5% 2019 2020 2021 Note: Lumber price appreciation more significantly impacts commodity - based products compared to value - add products. Sales % of Sales Commodity Value - added 2019 2020 2021 57.8% 42.2% 46.2% 43.2% 56.8% 53.8% Sunbelt Forest Products $774M 2021 DecKorators $249M 2021 UFP Edge $545M** 2021 Prowood $1,743M* 2021 *Includes $393M in Outdoor Essentials **Includes $396M in Retail Building Materials |
| 9 BUSINESS SEGMENTS & PRODUCT MIX EVOLUTION 2022 2013 $60m 3.7% New Products 5.0% $54m $136m 3.2% 2019 2020 2021 Sales % of Sales 2013 23.7% 81.4% 18.6% 73.0% 27.0% 76.3% Commodity Value - added 2019 2020 2021 Value - added as a Percent of Sales Note: Lumber price appreciation more significantly impacts commodity - based products compared to value - add products. Factory - Built $1.1B 2021 Commercial $259M 2021 Concrete Forming $150M 2021 Site Built $1.2B 2021 |

| 10 2022 BUSINESS SEGMENTS & PRODUCT MIX EVOLUTION 2013 $69m 6.3% New Products 8.2% $73m $177m 6.8% 2019 2020 2021 Sales % of Sales 2013 35.3% 66.2% 33.8% 67.7% 32.3% 64.7% Commodity Value - added 2019 2020 2021 Value - added as a Percent of Sales Protective Packaging Materials $19M 2021 Machine - Built Pallets $355M 2021 Structural Packaging and OEM Parts $1.8B 2021 Note: Lumber price appreciation more significantly impacts commodity - based products compared to value - add products. UFPindustial.com |

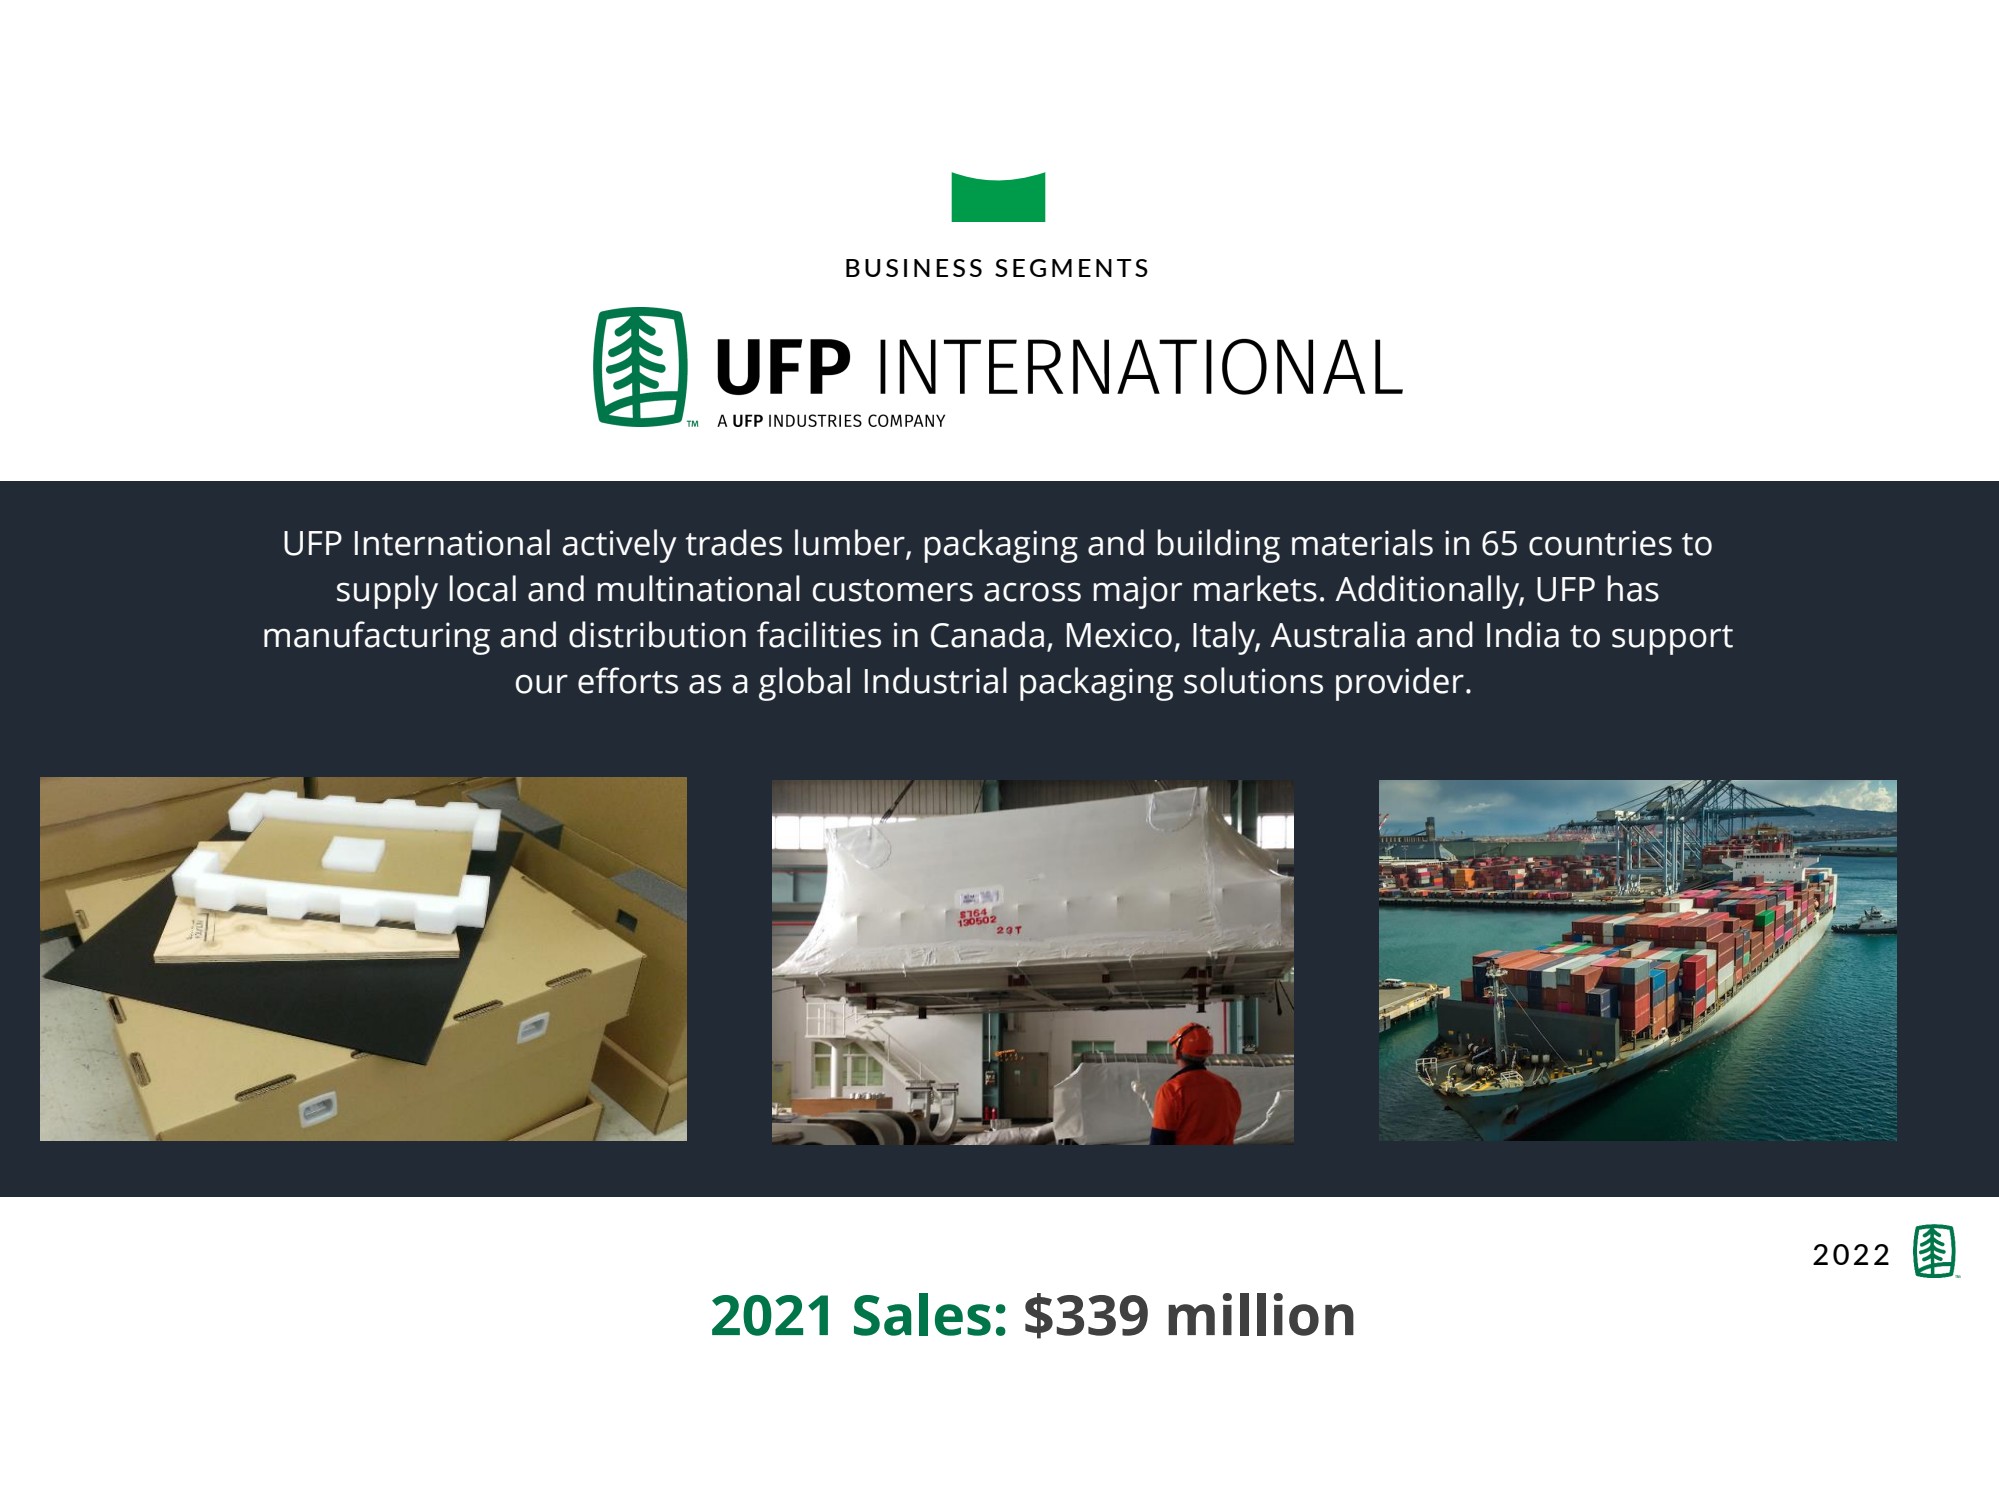
| 11 UFP International actively trades lumber, packaging and building materials in 65 countries to supply local and multinational customers across major markets. Additionally, UFP has manufacturing and distribution facilities in Canada, Mexico, Italy, Australia and India to support our efforts as a global Industrial packaging solutions provider. BUSINESS SEGMENTS 2022 2021 Sales: $339 million |
| 12 BUSINESS MODEL ACQUISITIONS 2022 PROCESS Identify attractive growth runways in each Business Unit under each Business Segment and identify gaps in our capabilities to pursue those runways. PURPOSE Find new products and services to speed our transformation from commodity sales to value - added selling solutions and brands. GOAL Achieve scale and synergy targets to optimize growth, margins and returns. |

| 13 BUSINESS MODEL A UNIQUE CULTURE BUILT FOR GOOD TIMES AND BAD 2022 Strong Balance Sheet Return - focused approach to capital allocation. Capital reserves used opportunistically. Average management team tenure: 23 years. 67 straight years of profitability. Every plant is a profit center and all employees bonused on ROI All managers required to own stock. Balanced Business Model Experienced Leadership Incentives Aligned With Shareholders Diversified business portfolio mitigates lumber and business risk. Mix of fixed - and variable - priced products hedges volatile lumber prices. Entrepreneurial Focused Stable Prepared |

| 14 FINANCIALS |
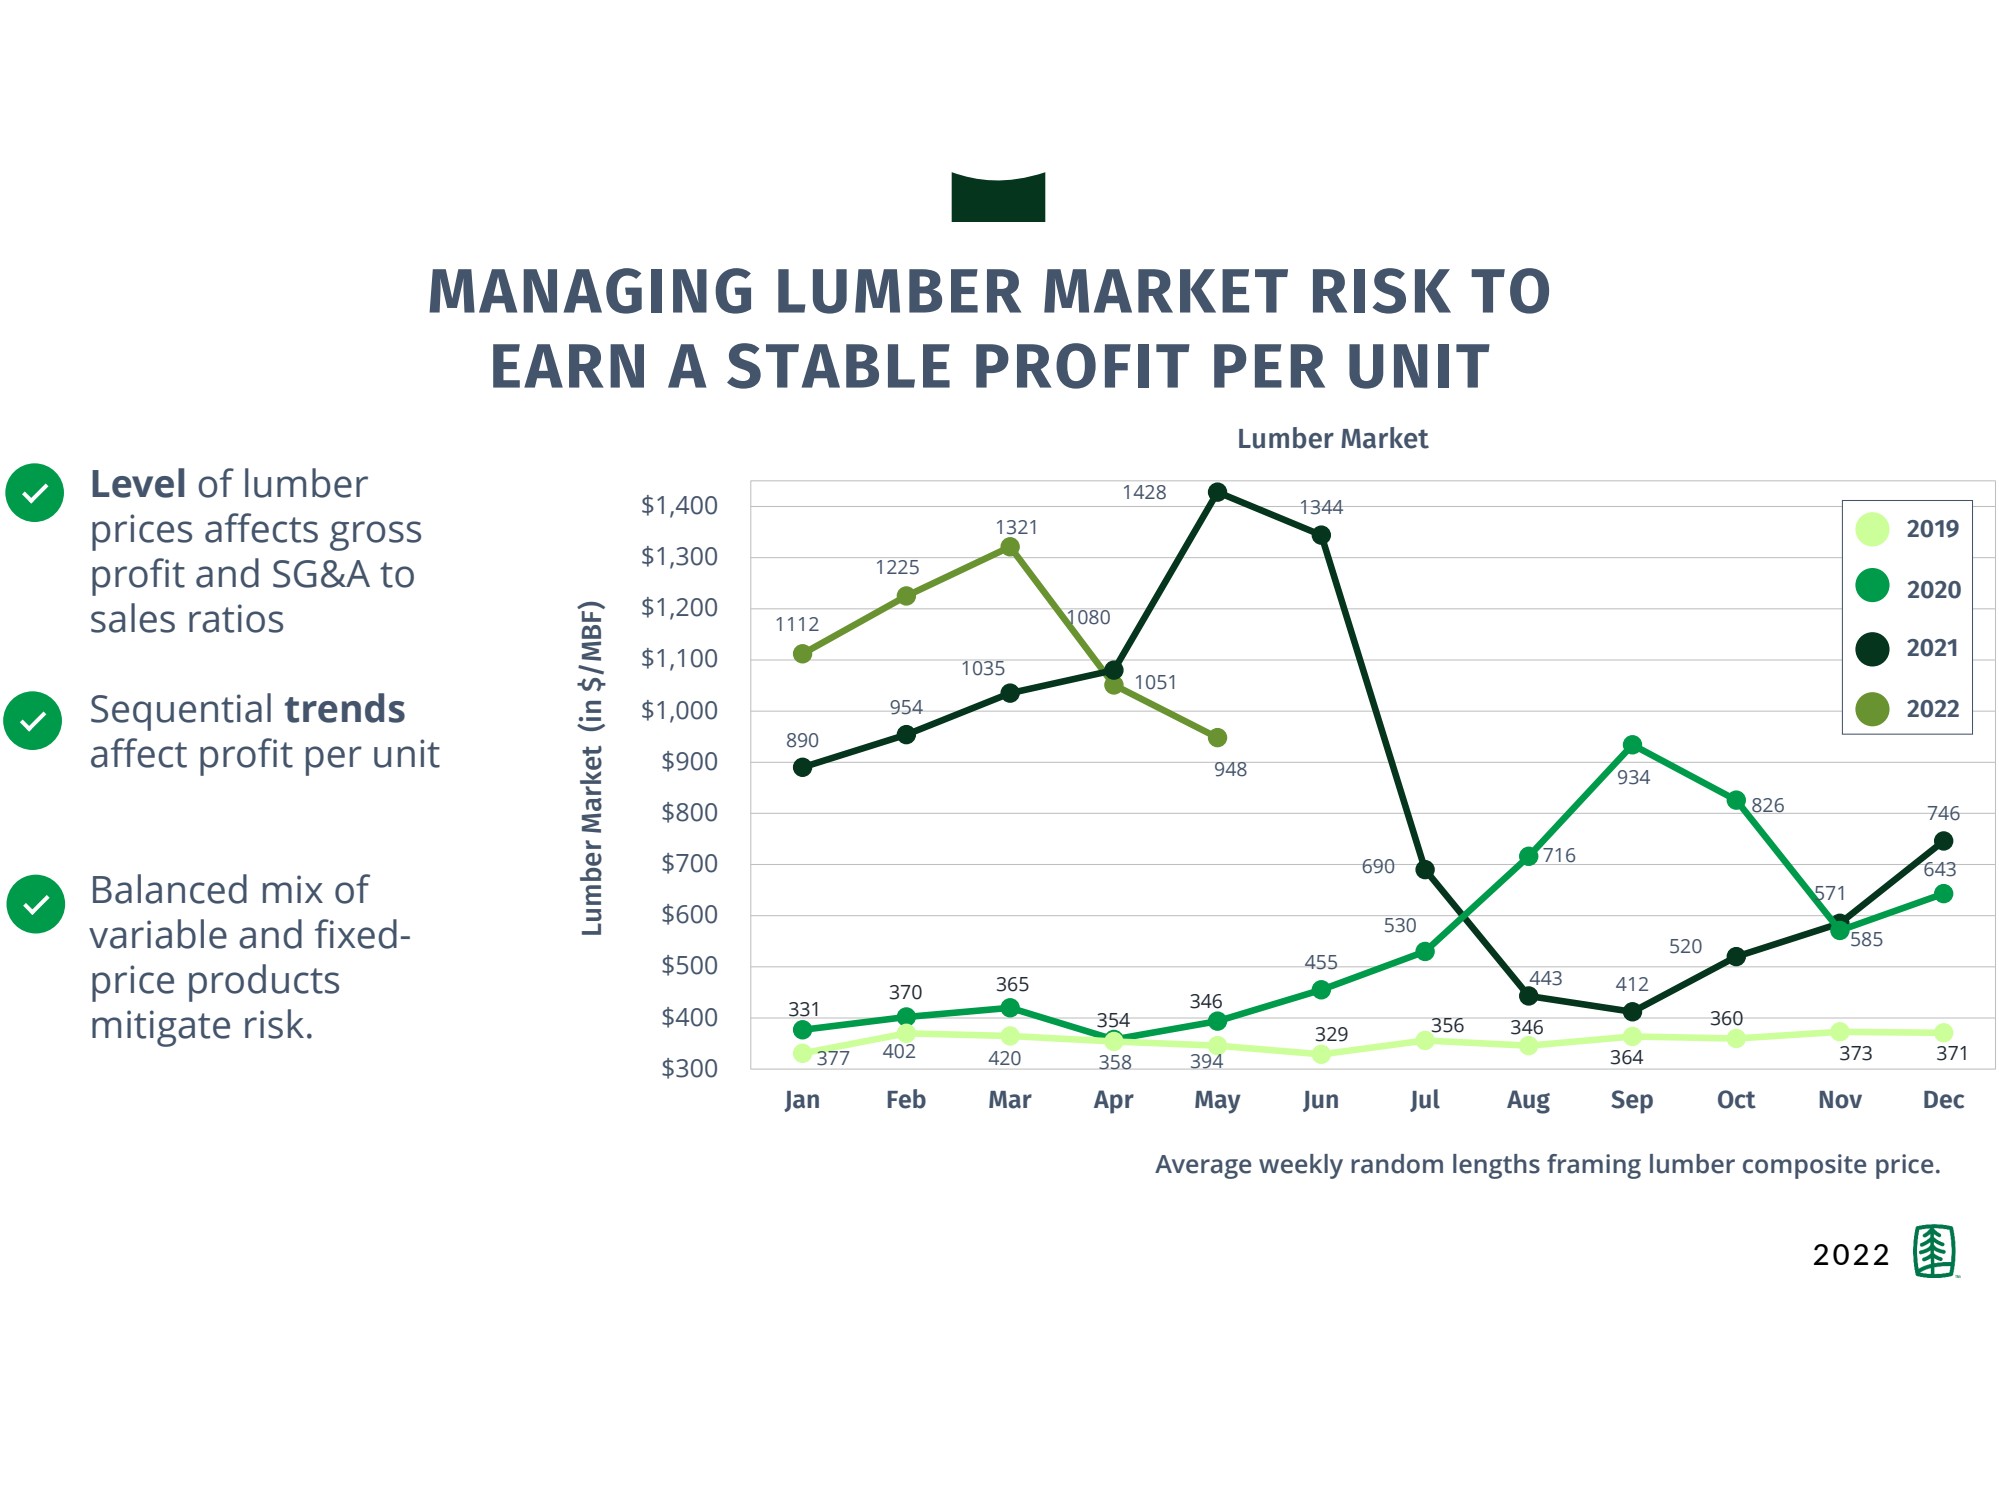
| 15 MANAGING LUMBER MARKET RISK TO EARN A STABLE PROFIT PER UNIT 2022 Level of lumber prices affects gross profit and SG&A to sales ratios Sequential trends affect profit per unit Balanced mix of variable and fixed - price products mitigate risk. 1112 1225 1321 1051 948 890 954 1035 1080 1428 1344 690 443 412 520 585 746 377 402 420 358 394 455 530 716 934 826 571 643 331 370 365 354 346 329 356 346 364 360 373 371 $300 $400 $500 $600 $700 $800 $900 $1,000 $1,100 $1,200 $1,300 $1,400 Jan Feb Mar Apr May Jun Jul Aug Sep Oct Nov Dec Lumber Market (in $/MBF) 2021 2020 2022 2019 Average weekly random lengths framing lumber composite price. Lumber Market |
| 16 $3,941 $4,489 $4,416 $5,154 $8,636 15% 6% 6% 6% 28% 4% 3% 5% 5% 4% 11% 3% 1% 1% 24% 0% 5% 10% 15% 20% 25% 30% 35% 40% 45% $- $1,000 $2,000 $3,000 $4,000 $5,000 $6,000 $7,000 $8,000 $9,000 $10,000 FINANCIALS 2022 NET SALES Acquisition Unit Sales Growth Organic Unit Sales Growth Total Unit Sales Growth Net Sales Long - Term Goal: Unit sales growth of 5% to 7%, including acquisitions Net Sales (in millions) Percent Change 2017 2018 2019 2020 2021 |

| 17 15% 6% 6% 6% 28% 14% 9% 16% 17% 76% 13% 12% 19% 36% 94% 0% 10% 20% 30% 40% 50% 60% 70% 80% 90% 100% 2017 2018 2019 2020 2021 FINANCIALS UNIT SALES AND PROFIT GROWTH 2022 Percent Growth Long - Term Goal: Achieve Adjusted EBITDA growth exceeding unit sales growth. Non - GAAP Financial Information: Please click here for reconciliation to related GAAP measurement. Unit Sales Growth Gross Profit Growth Adjusted EBITDA Growth |

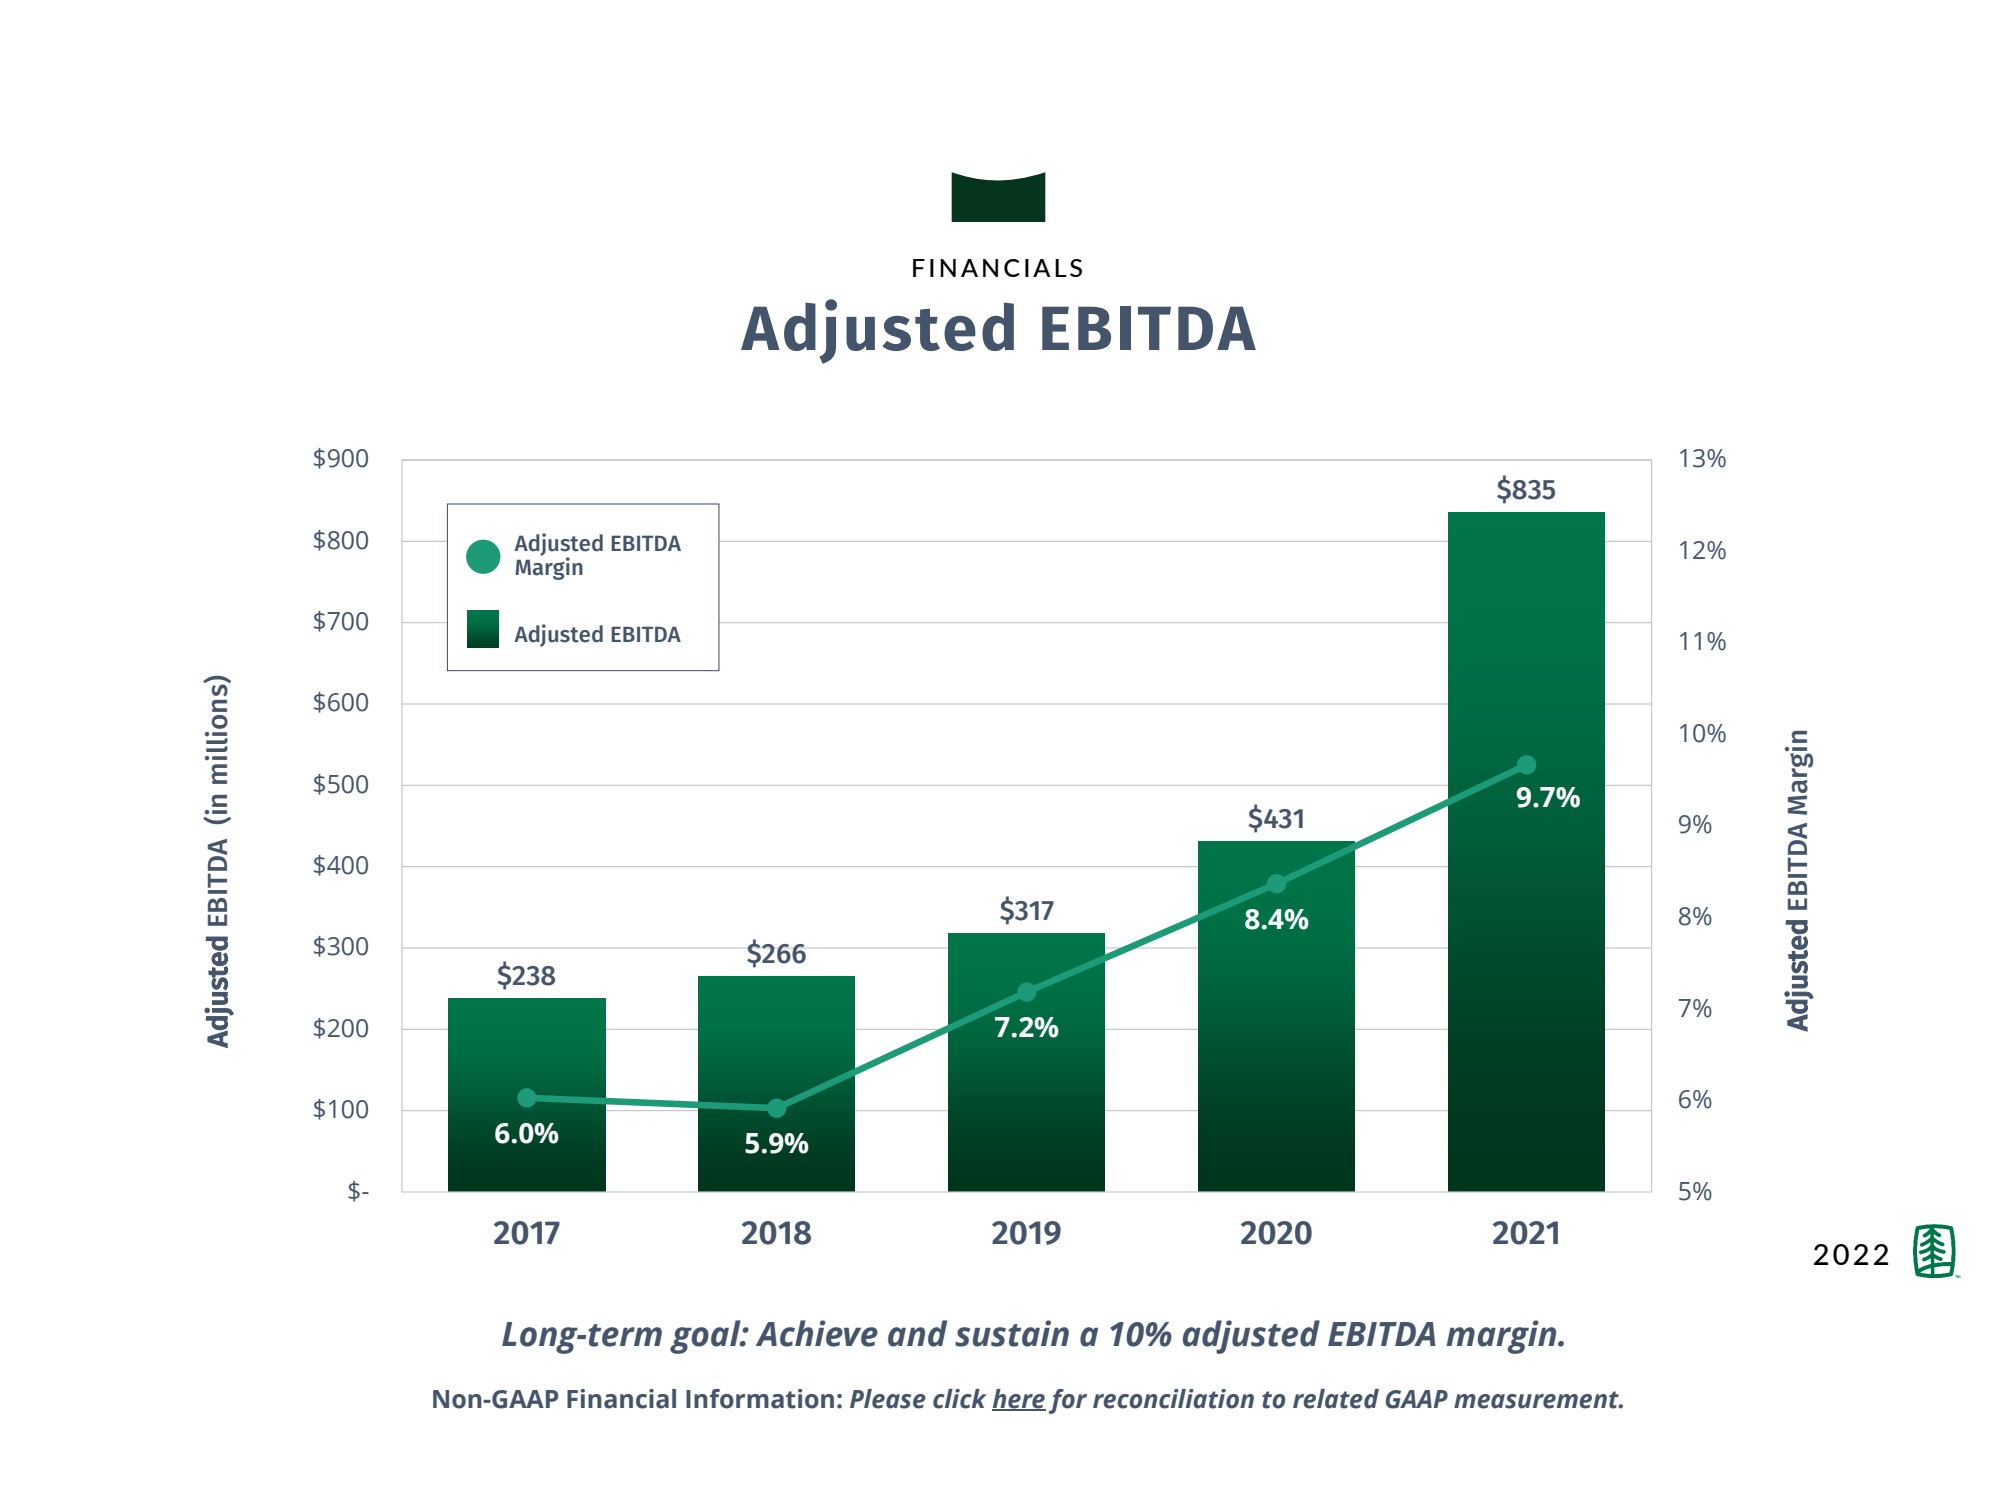
| 18 $238 $266 $317 $431 $835 6.0% 5.9% 7.2% 8.4% 9.7% 5% 6% 7% 8% 9% 10% 11% 12% 13% $- $100 $200 $300 $400 $500 $600 $700 $800 $900 2017 2018 2019 2020 2021 FINANCIALS Adjusted EBITDA 2022 Long - term goal: Achieve and sustain a 10% adjusted EBITDA margin. Non - GAAP Financial Information: Please click here for reconciliation to related GAAP measurement. Adjusted EBITDA Margin Adjusted EBITDA Adjusted EBITDA (in millions) Adjusted EBITDA Margin |
| 19 13.2% 14.0% 15.1% 21.0% 32.2% 0% 5% 10% 15% 20% 25% 30% 35% 2017 2018 2019 2020 2021 FINANCIALS RETURN ON INVESTED CAPITAL 2022 Percent Hurdle Rate = 12% WACC = 10% Long - term goal: Earning an incremental return on new investment over our cost of capital. Non - GAAP Financial Information: Please click here for reconciliation to related GAAP measurement. |

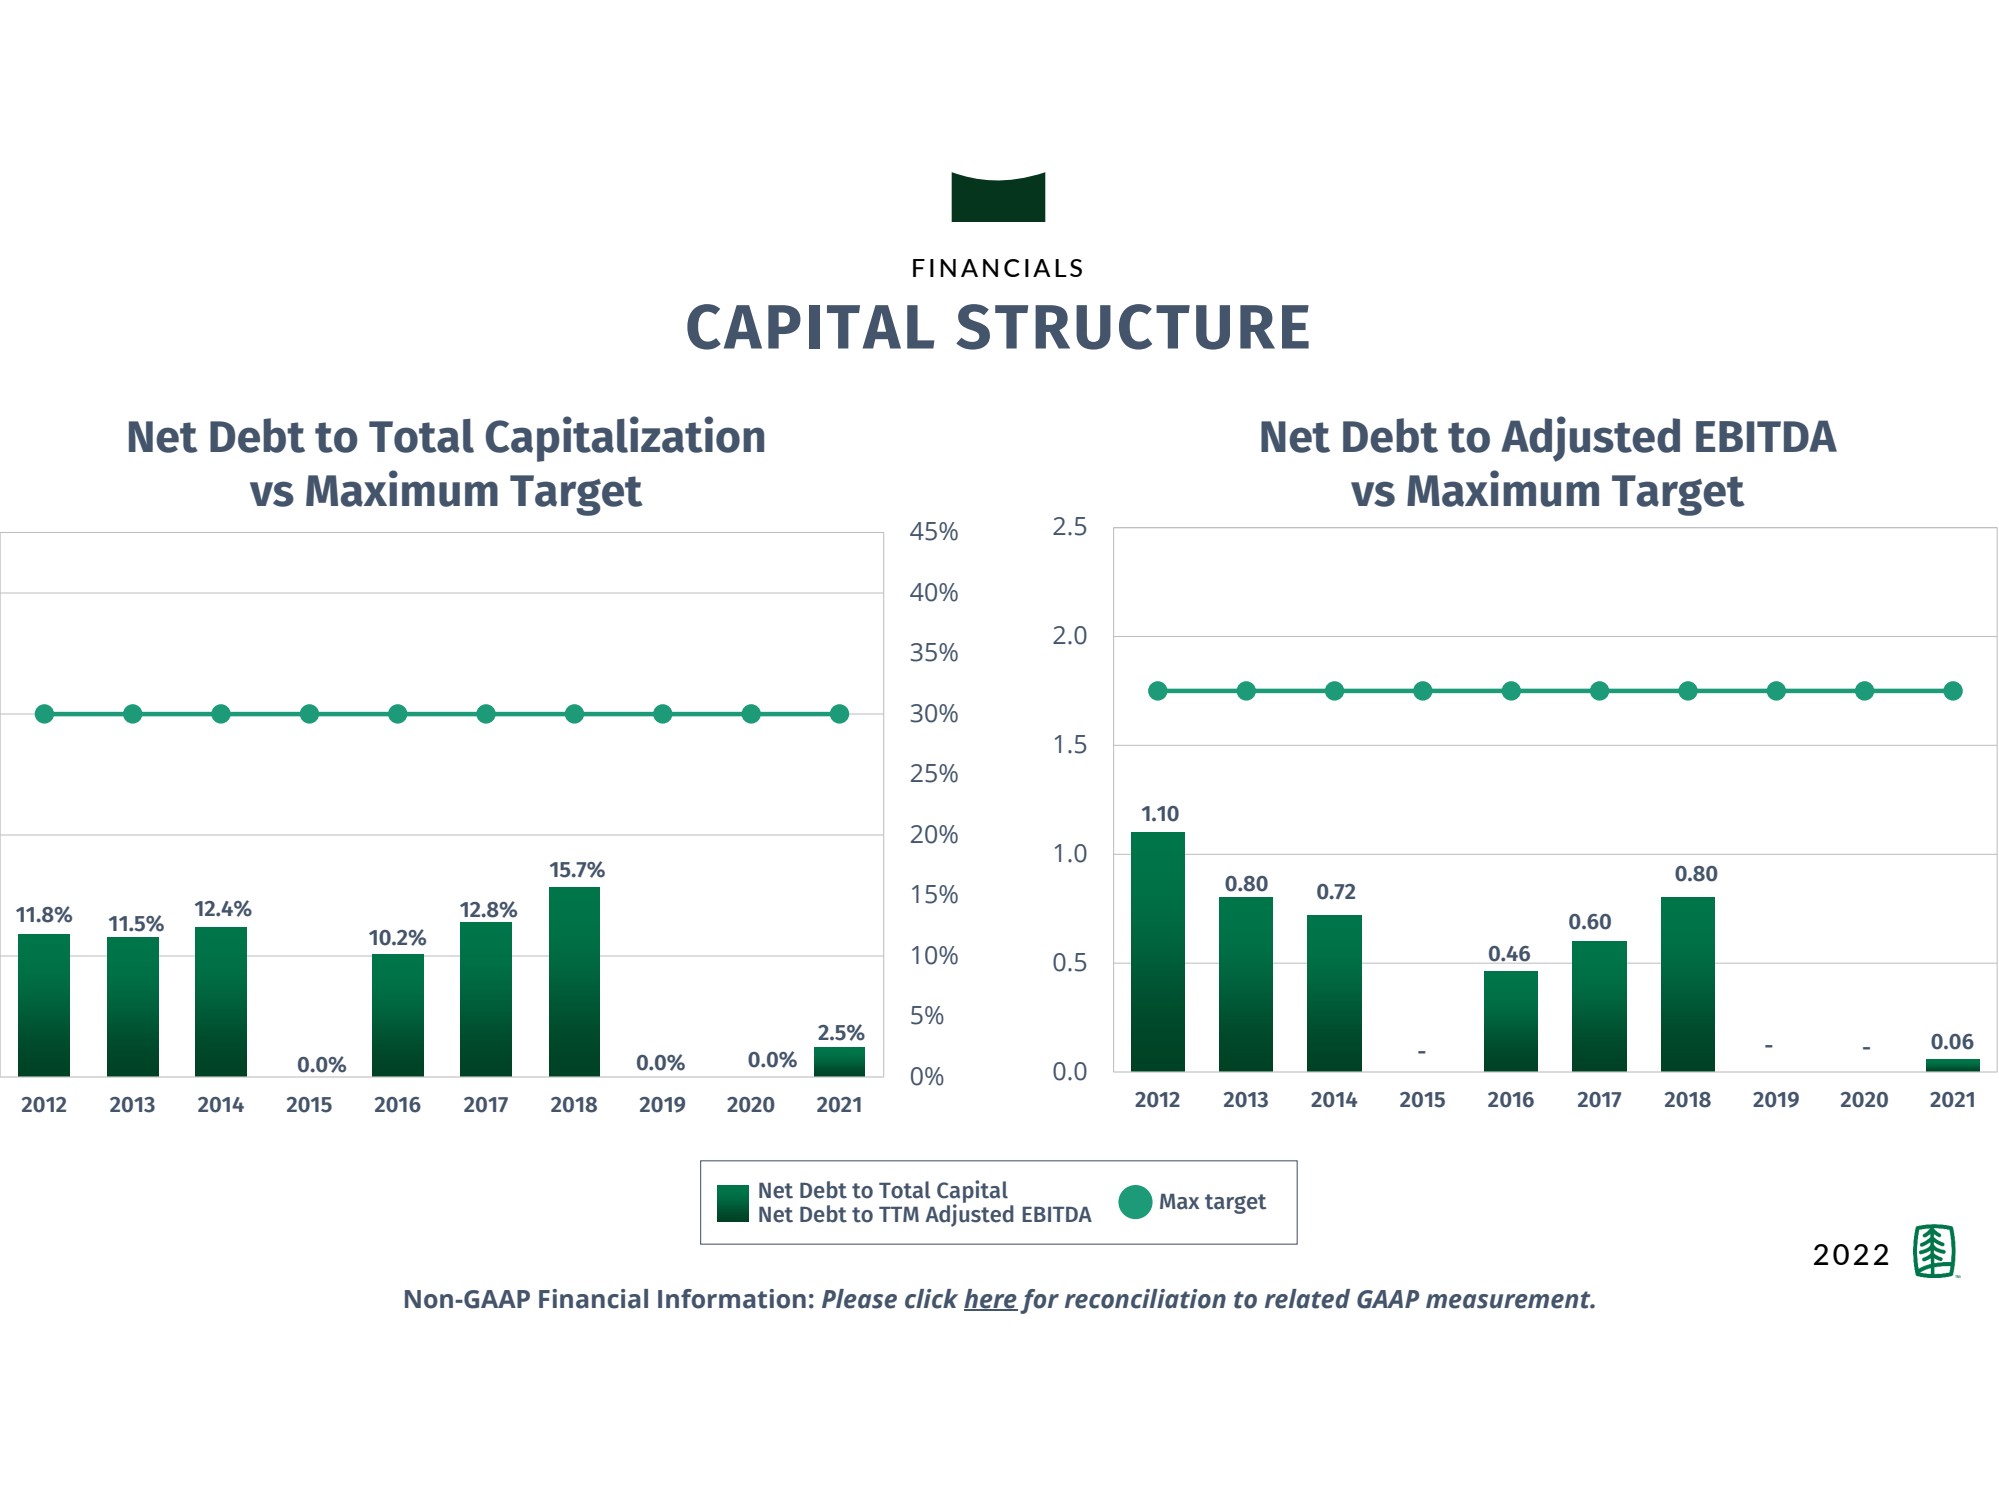
| 20 11.8% 11.5% 12.4% 0.0% 10.2% 12.8% 15.7% 0.0% 0.0% 2.5% 0% 5% 10% 15% 20% 25% 30% 35% 40% 45% 2012 2013 2014 2015 2016 2017 2018 2019 2020 2021 1.10 0.80 0.72 - 0.46 0.60 0.80 - - 0.06 0.0 0.5 1.0 1.5 2.0 2.5 2012 2013 2014 2015 2016 2017 2018 2019 2020 2021 FINANCIALS CAPITAL STRUCTURE 2022 Net Debt to Total Capitalization vs Maximum Target Net Debt to Adjusted EBITDA vs Maximum Target Max target Net Debt to Total Capital Net Debt to TTM Adjusted EBITDA Non - GAAP Financial Information: Please click here for reconciliation to related GAAP measurement. |
| 21 BALANCED USE OF FREE CASH FLOW 2022 Acquisitions to contribute half of our total annual unit sales growth Opportunistic share repurchases to offset issuances CapEx plan of $175M to $225M in 2022 Increasing dividends $349 $337 $513 $25 $31 $40 $85 $89 $151 $29 $39 $65 $476 Acquisitions Share Buybacks Capex Dividends OCF 2019 2020 2021 Operating Cash Flow and Capital Allocation (in millions) |

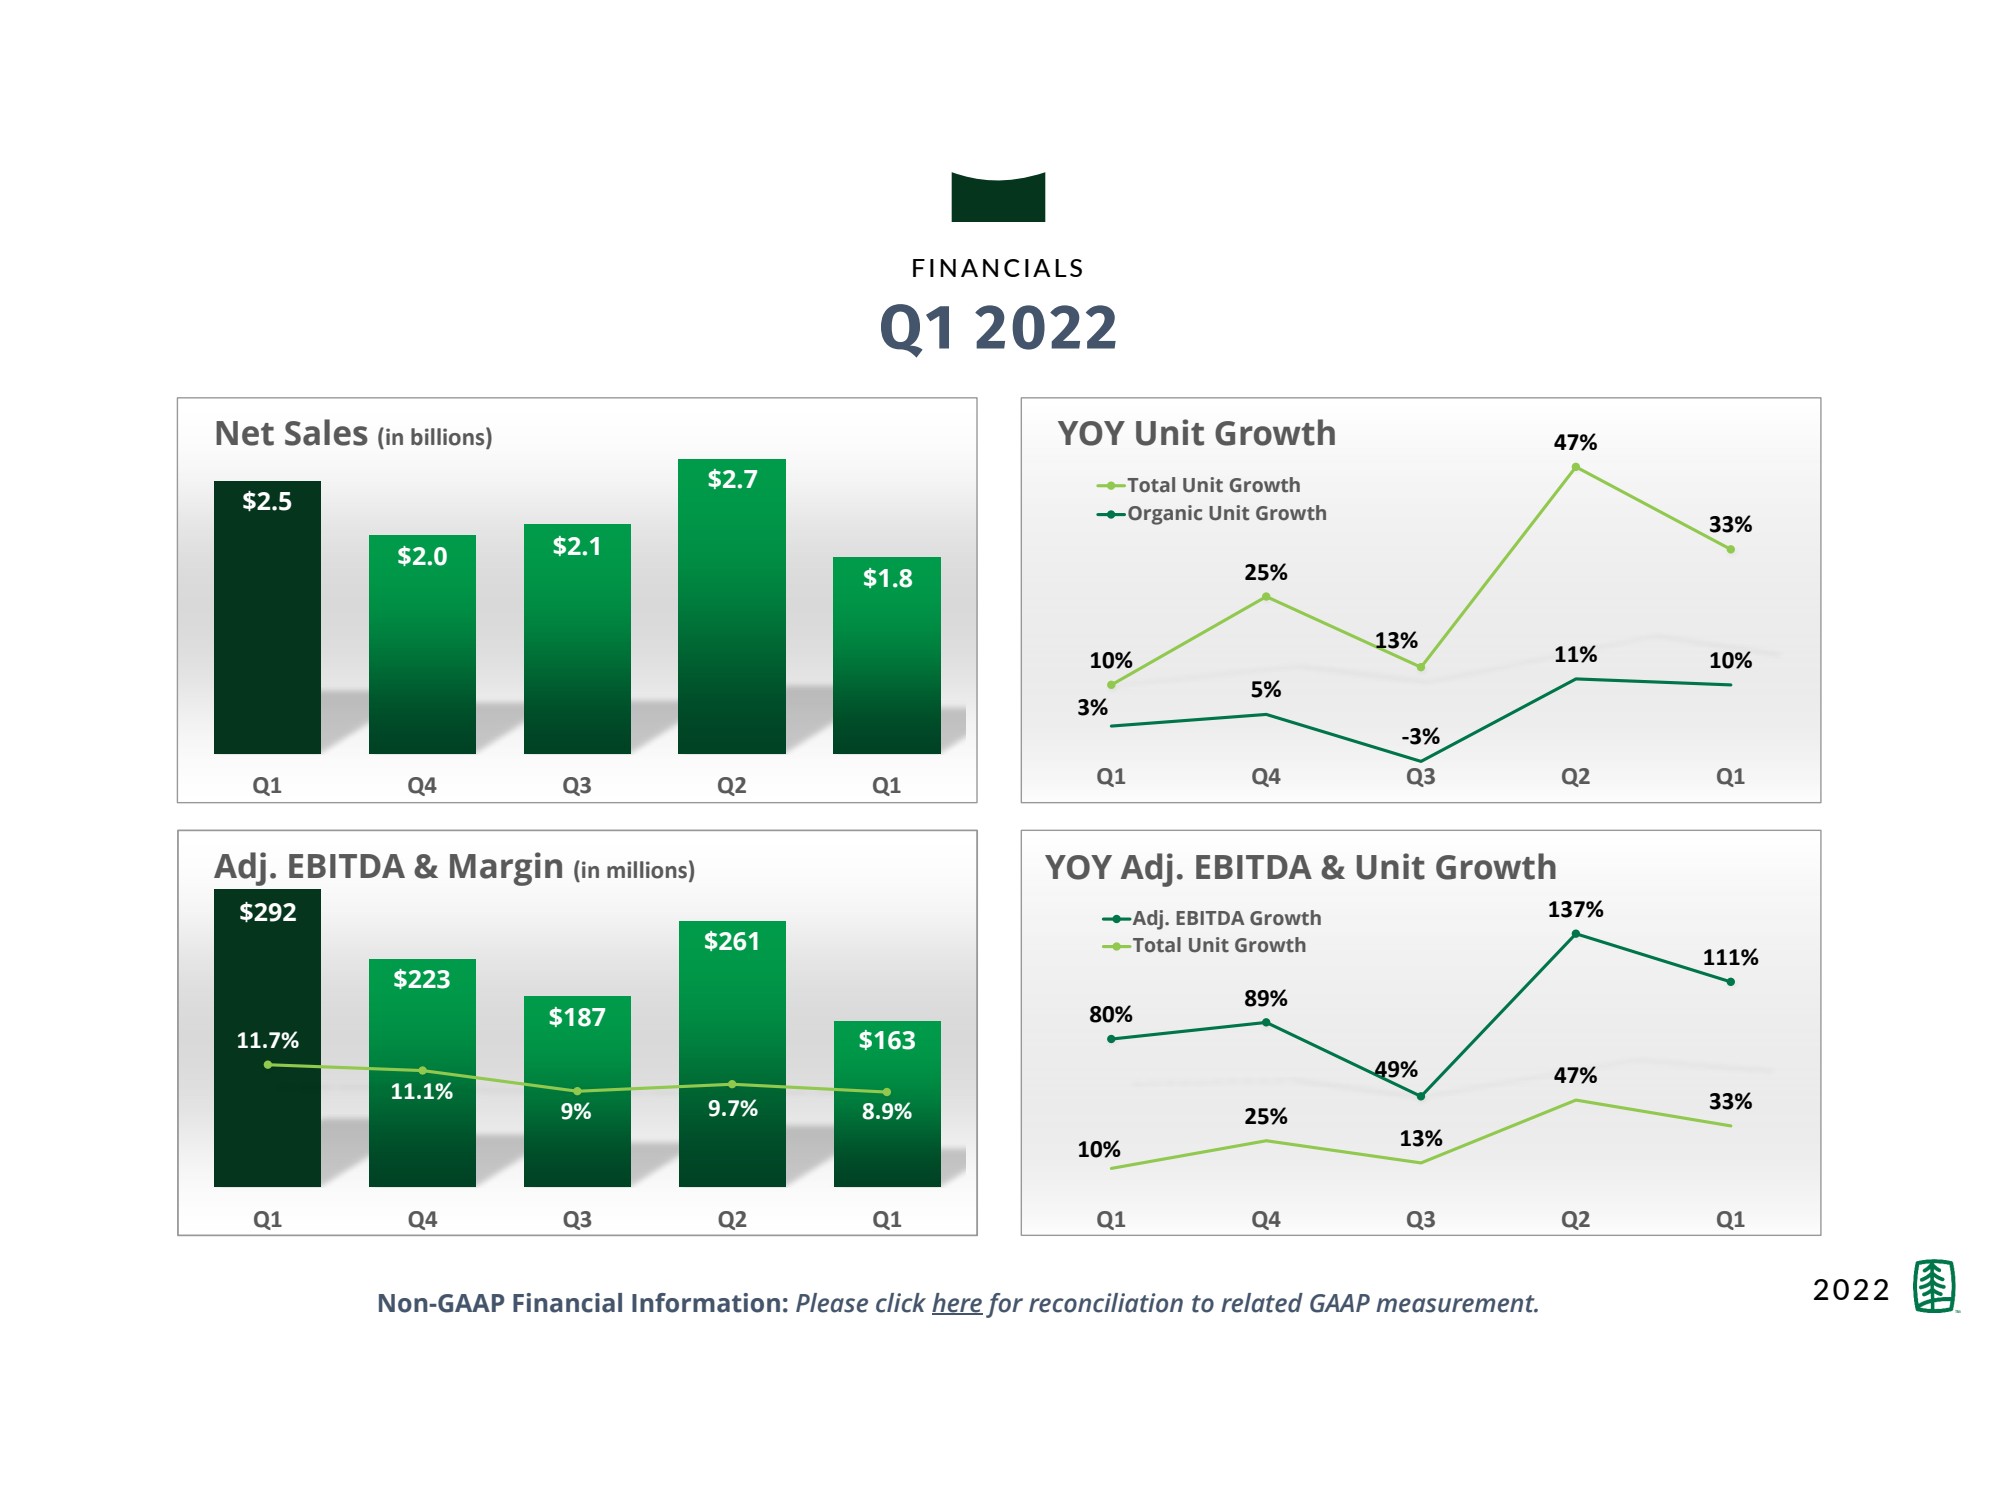
| 22 FINANCIALS 2022 Q1 2022 Non - GAAP Financial Information: Please click here for reconciliation to related GAAP measurement. Q1 Q4 Q3 Q2 Q1 Net Sales (in billions) $2.5 $2.0 $2.1 $2.7 $1.8 Q1 Q4 Q3 Q2 Q1 Adj. EBITDA & Margin (in millions) $292 $223 $187 $261 $163 10 % 25 % 13 % 47 % 33 % 3 % 5 % - 3 % 11 % 10 % Q1 Q4 Q3 Q2 Q1 YOY Unit Growth Total Unit Growth Organic Unit Growth 80 % 89 % 49 % 137 % 111 % 10 % 25 % 13 % 47 % 33 % Q1 Q4 Q3 Q2 Q1 Adj. EBITDA Growth Total Unit Growth YOY Adj. EBITDA & Unit Growth 11.7% 11 ..1% 9 % 9.7% 8.9% |
| 23 2801 E. Beltline Ave. NE Grand Rapids, MI 49506 (800) 598 - 9663 - UFPI.com THANK YOU. |